Temperature graphs
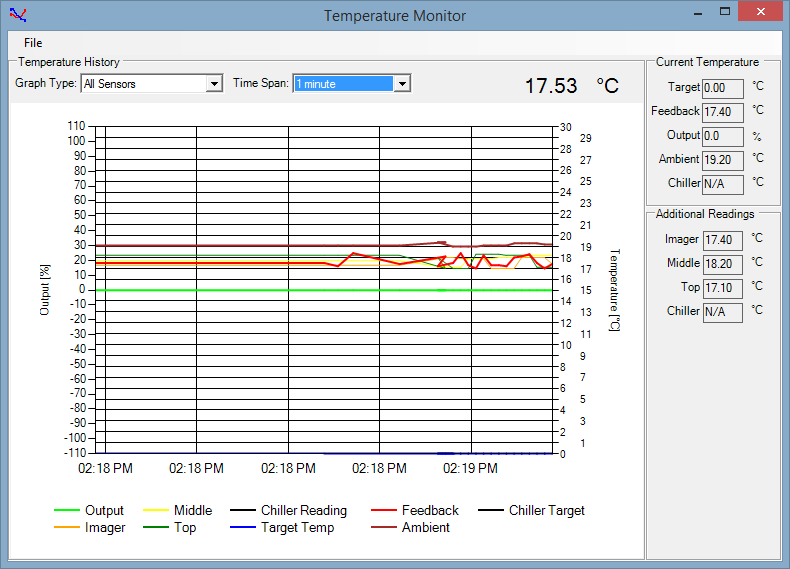
As certain experiments can be sensitive to temperature, at times you may want to view temperature information. To view the Temperature Monitor, go to the Temperature menu and select Temperature Graph.
The Temperature Graph plots the readings from Rock Imager's temperature sensors, as well as the average of the sensors and the output of the temperature controller.

Temperature graphs
At the top-left of the Temperature Monitor are two menus: Graph Type and Time Span. The Graph Type list provides the following graph options:
To change the graph type, click the list and select one of the options above.
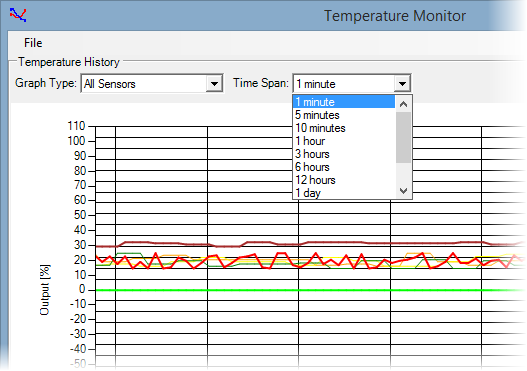
The Time Span is the amount of time shown on the X-axis of the Temperature History graph. To change the time span, click the drop-down box and select the desired value.

Time Span

|
|
| RIC-V30R016 |