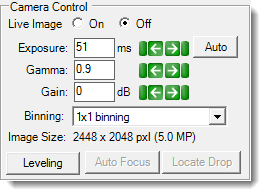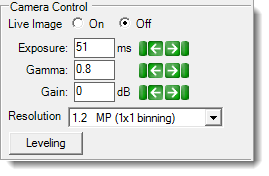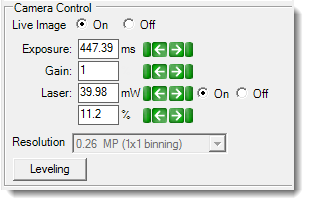


Camera Controls are used during manual imaging sessions to adjust the way your images appear on the screen. Adjusting these controls does not affect the way your images are captured during automatic scheduled imaging sessions, as those parameters are defined by the imaging setting(s) selected in Rock Maker.
The Camera Control panel is found on the Live Image Sub-Tab of the Imager Tab.
The contents of the Camera Control panel vary depending on the imaging method you are using. There are three possible Camera Control panels, as shown below. If you have the SONICC Rock Imager, for example, your Camera Control area will show one additional field called Laser, and the Auto Focus and Locate Drop buttons are hidden. Use the table as a guide to help you understand the various controls.
| General Camera Control Panel | UV Camera Control Panel |

|

|
SONICC Camera Control Panel |
|
| Control | Imaging Methods | Description | Notes |
|---|---|---|---|
| Live Image Button | ▶ Visible ▶ UV ▶ FRAP ▶ SONICC |
Turns the live image on or off. | The longer you keep a single drop under a live image, the more you subject your sample to heat, so we recommend turning the live image off when not actively inspecting wells. In SONICC, the first image will be mistimed, but can be reset by turning Live Image OFF and then ON again. |
| Exposure | ▶ Visible ▶ UV ▶ Fluorescence ▶ FRAP ▶ SONICC |
The Exposure field populates with the amount of time in milliseconds that the camera’s shutter remains open when capturing an image, which determines the amount of light allowed to fall on the camera's sensor affecting the image's brightness. | Click Auto to run the auto exposure algorithm (see About Auto Focus for more information.) |
| Binning and Image Size |
▶ Visible |
The display for resolution and image size have been split up and renamed as “Binning” and “Image Size” to accurately display the size of the image in pixels. For MFI images, the image size will be affected by the zoom control and image cropping on the camera. | Options depend on the camera you purchased. |
| Leveling | ▶ Visible ▶ UV ▶ FRAP ▶ SONICC |
Clicking the Leveling button will open the Leveling Histogram. The Leveling Histogram is used to adjust image brightness and contrast (see Leveling Histogram for further details). | If you adjust these settings, it only affects the way the Live Image displays, and not the way the image is captured. |
| Auto Focus | ▶ Visible | Clicking the Auto Focus button executes the Auto Focus algorithm. | See About Auto Focus for more information. Auto Focus settings can be configured for each plate type in the Plate Type Editor. |
| Locate Drop | ▶ Visible | Clicking the Locate Drop button executes the Drop Location algorithm on the drop currently in view. This algorithm analyzes the drop's well to determine the exact location of the drop and displays the results on the Drop Location tab. | This button is only available if Drop Location has been enabled for the plate type you are using, which is controlled through the Plate Type Editor. |
| Gain | ▶ Visible ▶ UV ▶ Fluorescence ▶ FRAP ▶ SONICC |
Used to amplify signal strength in low-light conditions, increase the sensitivity and make the image brighter. | Increasing the amount of gain can also increase the noise in an image. |
| Gamma | ▶ Visible ▶ UV |
This field affects the contrast of the midtones in the image. | When you modify this setting, only the midtones are affected, without affecting black and white. Changing this setting affects both the Live View and automatic imaging. |
| Laser | ▶ SONICC | This field affects the laser power at the sample. The On and Off buttons turn the Laser on and off. There is a percentage column to interpret the mW value of laser power to the percentage form. | Signal strength from both SHG and UV-TPEF imaging methods scales with the quadratic of the incident laser power. There is a large dynamic range of signal intensity from one sample. It is best to test a few drops with SONICC in manual mode to determine the optimal laser power. UV-TPEF: The signal intensity is dependent on the number of tryptophans in the protein. A good starting point would be at 100 mW, which is about 50% of the laser power available. SHG: The signal intensity is dependent on the presence or absence of a chromophore, crystal class and quality. For example, proteins with chromophores need only ~100 mW whereas 350 mW would be an appropriate power for other samples. A good starting point is 300 mW and then adjust according to your specific sample. The maximum laser power is ~550 mW (dependent on system), but take caution when using such high powers for extended periods on samples. Routine imaging with < 400 mW is optimal. |

|
|
| RIC-V30R016 |