Temperature graphs
As certain experiments can be sensitive to temperature, at times you may want to view temperature information. To view the Temperature Monitor, on the Temperature menu, click Temperature Graph.
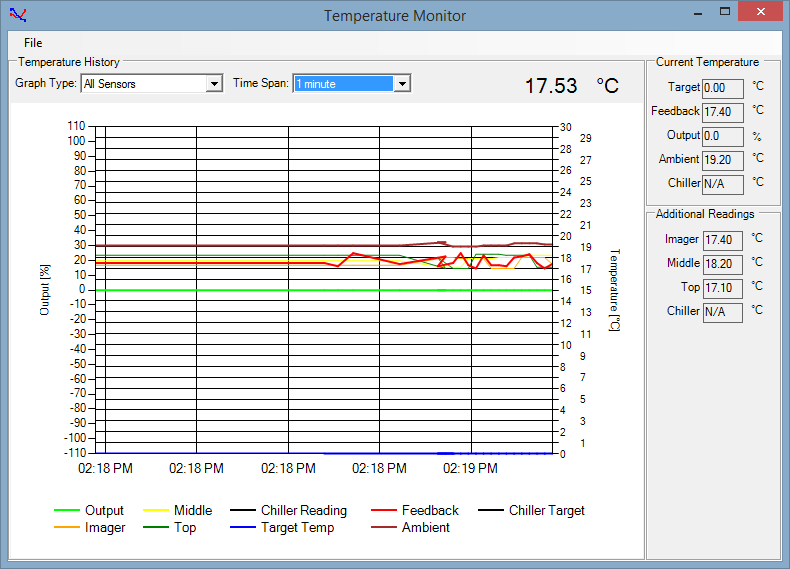
The Temperature Graph plots the readings from Rock Imager's temperature sensors, as well as the average of the sensors and the output of the temperature controller.

Temperature graphs
On the left side of the graph, the temperature controller's output level is represented as the percentage of total possible output.
On the right side, the temperature is represented in degrees Celsius.
The legend at the bottom of the graph tells you which temperature sensor or other value is represented by each line on the graph. The Current Temperature and Additional Readings areas at the right of the display provide important information at a glance.
At the top-left of the Temperature Monitor are two menus: Graph Type and Time Span. The Graph Type list provides the following graph options:
All Sensors: Graphs all sensors.
Average/Min/Max: Graphs the average of all sensors.
Feedback and Average: Graphs the feedback sensor and the average of all sensors.
Feedback and Output: Graphs the feedback sensor and the output graph line.
Chiller (Optional): Graphs the chiller sensor. This menu is available only if you install the chiller device.
To change the graph type, click the list and select one of the options above.
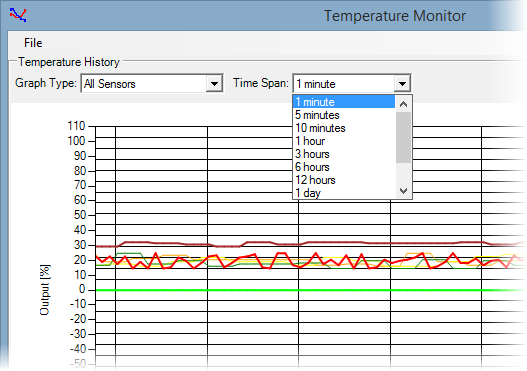
The Time Span is the amount of time shown on the X-axis of the Temperature History graph. To change the time span, click the Time Span list, and select the desired value.

Time span

|
|
| RIC-V31R016 |