Temperature graphs
Protein crystallization experiments require strict temperature control to be successful, so you may want to use the Temperature Graph to observe the current temperature and temperature history, and also to view more specific temperature data for particular time periods. The Temperature Graph is also a useful tool for troubleshooting, should you encounter any temperature issues with your Rock Imager system.
The Temperature Graph plots the readings from Rock Imager's temperature sensors, as well as the average of the sensors and the output of the temperature controller.

Temperature graphs
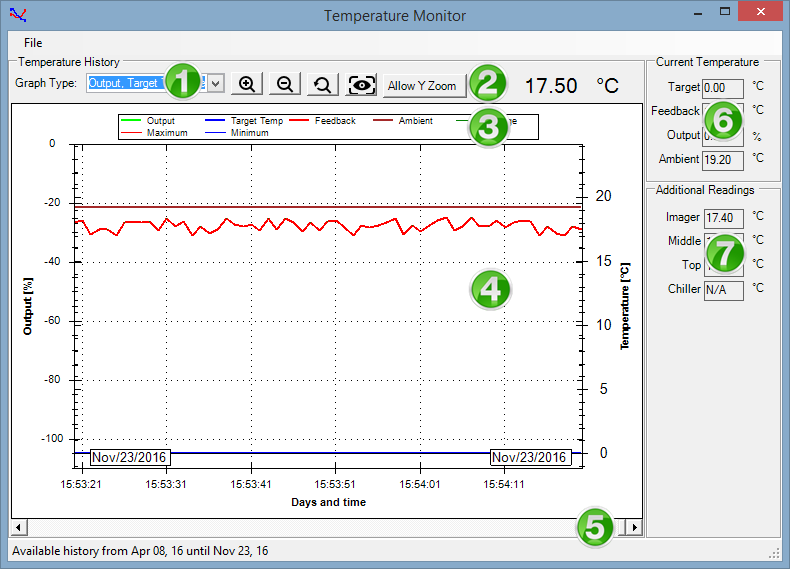
After you open the Rock Imager, click on the Temperature menu and select the Temperature Graph. The Temperature Monitor window appears.
The table that appears below explains in detail each section of the Temperature Monitor, which are: Graph Type, Temperature Monitor Toolbar, Legends, Graphs, The Slider, Current Temperature, and Additional Reading.
| Number | Name | Description |
|---|---|---|

|
Graph Type |
At the top-left of the Temperature Monitor. The Graph Type list provides the following graph options:
To change the graph type, click the list and select one of the options above. You can select more than one graph type by clicking the checkboxes on the left. If you want to select all of the sensors, you can click the checkbox next to Name. Note: Which sensors are available depends on which Rock Imager system you are using. |

|
Temperature Monitor Toolbar |
The Temperature Monitor Toolbar consists of:
Note: You can also use your mouse wheel to Zoom In and Zoom Out, and can click the mouse wheel to go to Normal Zoom. |

|
Legends | The legends at the top of the graph tells you which temperature sensor is represented by each line on the graph. Each line is shown in a particular color, representing each sensor that is available on the system. You can change which sensor(s) you want to show by right-clicking at the Temperature Graph and select the desired sensor(s). |

|
Graph |
On the left side of the graph, the temperature controller's output level is represented as the percentage of total possible output. On the right side, the temperature is represented in degrees Celsius. You can also save your Temperature Graph as an .EMF, .PNG, .GIF, .JPG, .TIF or .BMP file in your desired location. To save the Temperature Graph right-click on the Graph, select Save Image As, browse your desired location to save the image, and click Save. |

|
The Slider | The slider at the bottom helps you to move through different points in time from the temperature record’s history. |

|
Current Temperature |
The Current Temperature shows you the current temperature data which consists of:
|

|
Additional Reading | The Additional Reading shows you the current temperature data of the Rock Imager sensor systems, such as on the Imager, Middle, and Top. The amount of sensors available on the Temperature monitor depends on the Rock Imager System being used. |
Note: You can always check the history availability of the temperature data on the bottom-left side of your Temperature Monitor window.

|
|
| RIC-V33R116 |