Viewing Temperature Graphs

Protein crystallization experiments require strict temperature control to be successful, so you may want to use the Temperature Graph to observe the current temperature and temperature history, and also to view more specific temperature data for particular time periods. The Temperature Graph is also a useful tool for troubleshooting, should you encounter any temperature issues with your ROCK IMAGER system.

The Temperature Graph plots the readings from the temperature sensors inside of the ROCK IMAGER, as well as the average of the sensors and the output of the temperature controller.

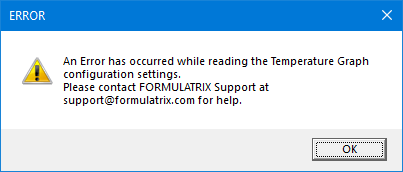
Important: If the below error message appears while opening the Temperature Graph, please contact support@formulatrix.com for assistance.

The Temperature Graph Error Message


Temperature Graph

To Use the Temperature Graph:

  1. In your ROCK IMAGER software, click the Temperature menu and select Temperature Graph to display the Temperature Graph window.

  2. The table below explains in detail each section of the Temperature Graph, including the Graph, Sensor Legends, Current Reading panel, Toolbar, and Slider.


    Number Name Description
    Graph

    The Graph shows you the current temperature data from your ROCK IMAGER instrument, or shows you saved temperature data from a previous point in time. It consists of a single X axis and two Y axes. The X axis displays the Time of the temperature recording in the chosen interval, whereas the Y axes display the Temperature level and the Output. The Temperature is represented in degrees Celsius, while the Output of the temperature controller is represented as the percentage of total possible power usage for the temperature control. The data taken from each temperature sensor in ROCK IMAGER is displayed in a different color, for easy identification. For more information about the sensor’s colors, see Sensor Legends below.

    Note: If you close the ROCK IMAGER software, the system will stop monitoring the temperature sensors. You can still display the Temperature Graph window, allowing you to view records of past temperature data.

    To see the exact temperature reading from a sensor, hover your mouse over the corresponding sensor line on the Graph. You can also double-click anywhere on the gray background area of the Graph to show you data about that particular point, including the time, temperature, and output.

    Information Tooltip That Appears When Hovering the Mouse Pointer over a Sensor Line

    You can scroll your mouse wheel up and down to slide the graph to the right and left, respectively. Scroll down to view the recorded data from the past, or scroll up to move forward up to the current data.

    To change the time interval used on the X axis, press the Ctrl key on your keyboard while scrolling your mouse wheel up or down. Scrolling up shortens the time interval down to a minimum of one minute, whereas scrolling down lengthens the time interval up to a maximum of one hour.

    Sensor Legends

    The Sensor Legends at the top of the graph tells you which temperature sensor is represented by each line on the graph. Each line is shown in a particular color, representing each sensor that is available on the system.

    Tip: To easily locate a specific data line on the graph, you can hover your mouse pointer over the desired temperature sensor in the list on the Sensor Legends panel. The corresponding data line will be highlighted accordingly.

    Note: The list of sensors shown in the Sensor Legends depends on the options defined in the Settings. For more information, see the Toolbar section below.

    Current Reading Panel

    The Current Reading panel shows you the current temperature data taken from the ROCK IMAGER sensors. To display the Current Reading panel, click the Settings button the Toolbar, and select Show Temperature Info. You can also deselect the Show Temperature Info option to hide the Current Reading panel.

    Note: The sensors visible on the Temperature Graph depends on the type of ROCK IMAGER system that you have.

    Note: The Current Reading panel only shows you current live data, even if you switch the graph to a different period.

    The Current Reading panel consists of the data value for the following sensors:

    • Output — Shows you the percentage of the total possible power result for the temperature control.

    • Middle — Shows you the temperature taken from the the ROCK IMAGER’s middle sensor.

    • Feedback — Shows you the current temperature value taken from the ROCK IMAGER’s feedback sensor. In order to reach the Target temperature, ROCK IMAGER will either increase or decrease Output based on the value of Feedback sensor. Target — Shows you the target temperature, as set by the user . ROCK IMAGER will increase or decrease Output until the Feedback temperature matches the Target temperature. To set the Target temperature, go to the Temperature menu, select Temperature Settings, and input the value in the Target Temp box. Then click OK.

    • Average — Shows you the average temperature of all of the sensors in your ROCK IMAGER system.

    • Maximum — Shows you the hottest temperature detected by any of the sensors.

    • Minimum — Shows you the coldest temperature detected by any of the sensors.

    • Ambient — Shows you the room temperature value.

    • Imager — Shows you the temperature read by the Imager sensor of ROCK IMAGER system.

    • Bottom — Shows you the temperature read by the Bottom sensor of ROCK IMAGER system.

    Toolbar

    The Toolbar consists of:

    • Settings button — Click this button to enable and disable the available settings in the Temperature Graph:
      • The Show Graph option allows you to choose how you want the live data to be displayed in the Graph and Sensor Legends. You can select All Sensors to display the Output, Middle, Feedback, Target, Top, Ambient, and Imager sensors. Selecting the Average/Max/Min option will display the Average, Minimum, and Maximum of the current temperature result from all sensors. The Feedback and Average option allows you to show the Feedback, Average, Output, and Target temperature. To display the Feedback, Output, and Target temperature, select Feedback and Output. You can also display one or more sensors line in the Graph and Sensor Legends, by selecting the sensor name(s) listed, option includes Output, Middle, Feedback, Target, Average, Minimum, Maximum, Top, Ambient, and Bottom. To hide a sensor line from the display, you can deselect it accordingly.

    Selecting Sensors to be Displayed in the Graph and the Sensor Legends

    • The All option allows you to automatically display all sensors’ data and list all of the sensors in the Sensor Legends.

    • The None option allows you to hide all sensors’ data in the Temperature Graph.

    • The Show Tooltip option allows you to enable updated temperature notifications when the Temperature Graph window is minimized.

    • The Show Temperature Info option allows you to display the Current Reading panel.

    • The Settings option allows you to define the minimum and maximum values used for the Y axes in the Temperature Graph. You can define the minimum and maximum temperature by typing the desired values in the Min Temp and Max Temp fields, and set the minimum and maximum output values by typing the desired values in the Min Output and Max Output fields.

      ROCK IMAGER can refresh the Temperature Graph data to reduce the amount of memory used by the software. You can set the Refresh Interval value to determine how frequently this data is refreshed. When you view temperature data that was recorded before the latest refresh, each sensor line will show only the average of all of the values recorded.

      The Settings Window

    • The Exit option closes the Temperature Graph window without displaying any confirmation message.

    Note: If you click the Close button to close the Temperature Graph window, the below message will appear. You can close the window, minimize the window, or keep the window open, by selecting Yes, No, or Cancel respectively.

    The Temperature Graph Confirmation Message

    • Zoom In button — Click this button to observe the temperature graph data in smaller time interval, for example from days to hours or minutes to seconds.

    • Zoom Out button — Click this button to observe the temperature graph data in the larger time interval, such as seconds to hours or hours to days.

    • Reset Zoom button — Click this button to observe the temperature graph at the original zoom.

    • Live Temperature button — Click this button to observe the live temperature data of your current imaging.

    Note: To preserve memory capacity, the system will refresh the data automatically every four hours from the first time you enable the live temperature readings. Temperature data older than the last refresh will only show the average value of each sensor line.

    • Best Y Zoom button — Click this button to adjust the Y axes’ magnitude to its best view so that all the temperature and output graphic data that are recorded will be properly displayed.
    • Jump to Date button — Click this button to view the temperature data from a certain date. Define the year, month, and day as desired in the Calendar window.

    • The Average Value toolbar — Use this informative toolbar to quickly view the average temperature of all of all temperature sensors.

    • The Status Bar — Gives you up-to-date information about what’s going on with your ROCK IMAGER Temperature system and alerts you to any important changes in temperature.

    The Status Bar

    Slider

    The slider under the Graph field helps you to move through different points in time from the temperature record’s history. It consists of:

    • The Slide Bar — Allows you to move the graph view backward or forward in time. You can also use the left or right arrow buttons to move the graph view backwards or forwards.

    • The First button — Allows you to jump to the earliest temperature data recorded that day.

    • The Last button — Allows you to jump to the latest temperature data recorded that day.

    • The Prev Day button — Allows you to jump to the earliest temperature data recorded on the day before the currently opened data was recorded.

    • The Next Day button — Allows you to jump to the earliest temperature data recorded on the day after the currently opened data was recorded.


Related Topics


RIC-V38R119

10 DeAngelo Drive

Bedford, MA 01730

USA


+1-781-788-0228

support@formulatrix.com

publications@formulatrix.com