Open topic with navigation
Histogram
The CONSTELLATION software provides you with two types of histograms. The first one is the standard histogram that will be displayed if the reference filter (ROX) is selected, and the second one is a partition scatterplot that is used for multiplex filters (for example VIC + FAM).
After opening imaging results, you can access the Histogram screen by tapping the Histogram button  on the top toolbar. The histogram enables you to adjust the threshold for each filter. A threshold is an average brightness value of a partition, below which a partition will be interpreted as negative (or empty, for a reference filter), and above which a partition will be interpreted as positive (or full, for a reference filter).
Standard Histogram
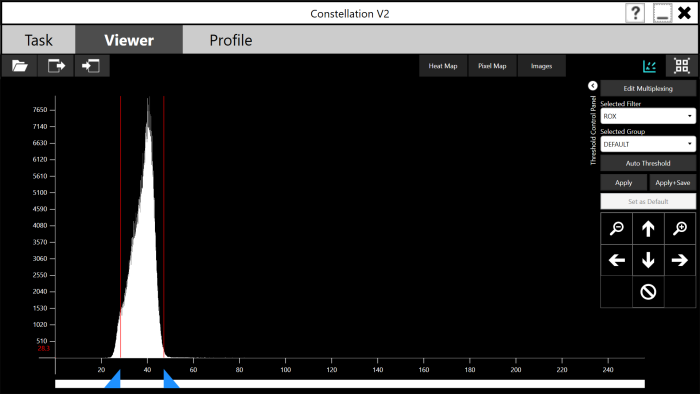
The standard histogram works through two parameters, the lower limit and the upper limit, which are represented by blue triangles below a histogram image. You can drag each of these triangles to the left or right to adjust the starting and ending histogram values. Changing the values will affect both positive and negative partitions.
For reporter dye filters, the left peak corresponds to negative partitions, and the right peak corresponds to positive partitions. For the reference filter (ROX), the left peak corresponds to empty partitions, and the right peak corresponds to filled partitions. For best results, try placing the threshold between these two peaks. For more information on how to set the threshold values, see the tutorials below.

The Standard Histogram Screen
To set the threshold for the reference filter:
-
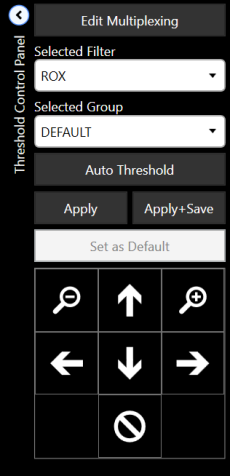
Go to the Threshold Control Panel on the right side of the standard Histogram screen.

Threshold Control Panel
-
Select the reference filter (ROX) from the Selected Filter drop-down list. The histogram image will update to show the brightness values of the partitions in the selected filter.
-
Select the desired group from the Selected Group drop-down list. See also, Group Selection.
-
Adjust the threshold using the slider so that the threshold falls between the two peaks.
OR
Tap the Auto Threshold button.
-
Tap the Apply button to update the partitions.
OR
Tap the Apply + Save button to save the changes to the results file for future review.
Note: Changes will be discarded unless you tap the Apply + Save button. Thresholds for all filters must be set to ensure proper quantification.
Besides setting up the threshold, you can also easily combine and compare non-reference filters (multiplexing). The CONSTELLATION can multiplex up to five channel filters per sample. The default filters are FAM and VIC or HEX. The others can be configured at will. Follow the tutorials below to compare filters.
To compare filters:
-
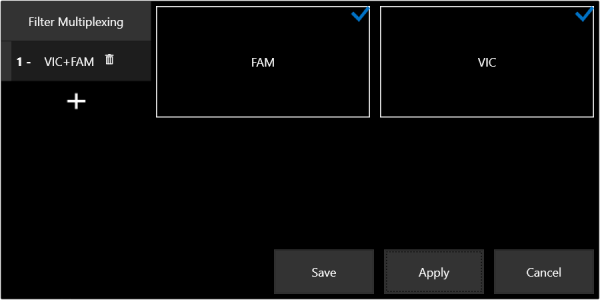
On the Threshold Control Panel, tap the Edit Multplexing button to display the Filter Multiplexing window.

The Filter Multiplexing Window
-
Tap the plus button  .
.
-
Select filters that you wish to compare.
-
Tap Apply, and then tap Save. The multiplex filters will be available in the Selected Filter drop-down list.
Partition Scaterplot
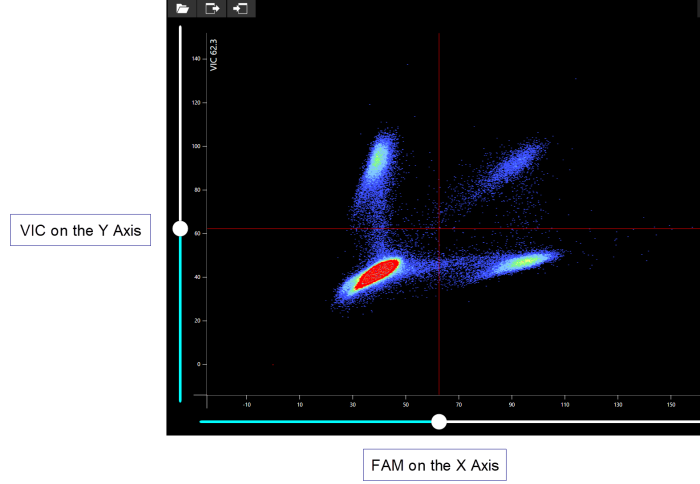
The partition scatterplot is displayed when multiplex filters (for example VIC + FAM) in the Selected Filter list are selected. This histogram can be used to view the amplification of each partition in two data filters simultaneously.
The X value of each point is the average brightness of that partition in the first data filter after normalization by the reference filter, and the Y value is the average brightness of that partition in the second data filter after normalization by the reference filter. For example, a partition that fluoresces in VIC but not FAM is indicated by a high Y value and a low X value.
For reporter dye filters, the left peak corresponds to negative partitions, and the right peak corresponds to positive partitions. The threshold values for each filter are drawn over the scatterplot as red lines (their position on each axis being their value in that filter). The thresholds are set using a slider on each axis.
Ideally, a given assay will contain four groups corresponding to the four possible combinations of positive or negative signals in both filters.
The scatterplot can optionally highlight different experiment groups. To highlight different experiment groups, select a different group from the list. The selected group is displayed with red points instead of white, and the group’s thresholds display.

The Two-Dimensional Histogram Screen
Related Topics
|
|

|
| COC-V20R018
|
|
 on the top toolbar. The histogram enables you to adjust the threshold for each filter. A threshold is an average brightness value of a partition, below which a partition will be interpreted as negative (or empty, for a reference filter), and above which a partition will be interpreted as positive (or full, for a reference filter).


 .
.
