The pixel map displays how the image analysis software has assigned positive or negative values to the partitions. If you are viewing imaging results with ROX, positive partitions are shown in red, and negative partitions are yellow. If you are viewing imaging results with FAM or VIC, positive partitions are shown in green, and negative partitions are yellow.
![]()
The Pixel Map screen
The pixel map should be compared with the images map to ensure that the thresholds for each filter and all imaging settings have been correctly set. Follow the tutorial below to compare the pixel map and images.
In the Pixel Map tab, check the threshold settings for the reference filter (ROX) and non-reference filters:
Select the reference filter (ROX) from the filter list.
Tap the Histogram button  .
.
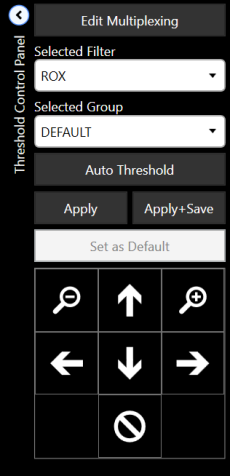
On the Threshold Control Panel, select ROX in the Selected Filter list.

Threshold Control Panel
Tap the Auto Threshold button to use the automatic threshold adjustments.
Tap the Apply button. At this point, you will need to check the thresholds for non-reference filters. For more information on how to use histogram settings, see Histogram.
Tap the Pixel Map tab to view the Pixel Map.
Select the desired non-reference filter that you would like to compare from the filter list.
Click the Histogram button  .
.
On the Threshold Control Panel, select the desired non-reference filter(s)/multiplex filters in the Selected Filter list.
Tap the Auto Threshold button to use the automatic threshold adjustments.
Tap the Apply button, and then return to the Pixel Map tab.
In the Pixel Map tab, tap the desired well that you would like to compare.
While viewing your selected well, tap the Images tab to compare the image of the selected well. Positive partitions in the Pixel map should look similar to the well image in the Images tab. If they do not look similar, you can re-adjust the Histogram thresholds.
![]()
A Well Viewed in the Pixel Map tab (Left) and Images Tab (Right)

|
|
| COC-V20R018 |