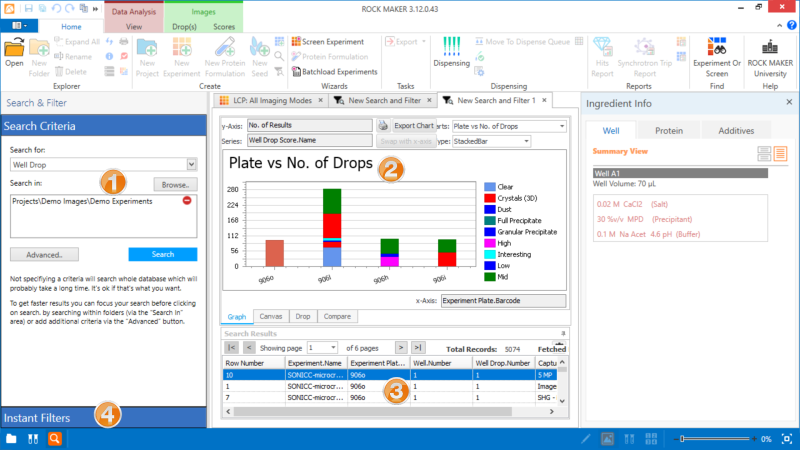
The Search and Filter interface comprises a number of dock panels and tabs for searching and viewing experiment data. These are explained in the following sections:

Search and Filter Interface
The Search Criteria panel is where you define the Search for and the Search in values. The Search for value can be a project, experiment, protein formulation, experiment plate, well, well drop, well ingredient, region annotation, screen, or screen hits. Select what you are looking for in Search for, then click Browse. Then, browse a project, an experiment or even the whole folder from the search location, click  and click OK. Your selected search location will appear in the Search in table. Next, click Search.
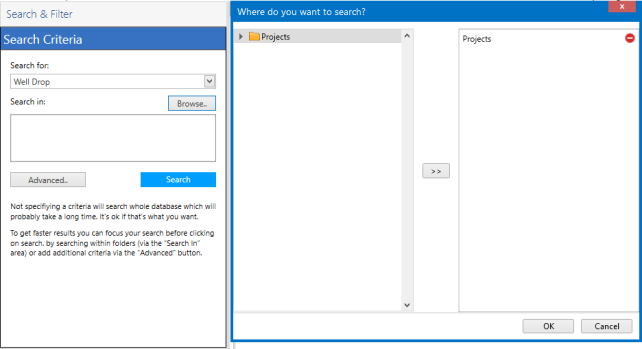
Search Criteria Panel
The Advanced options contain two tabs that provide tools for more specific search queries:
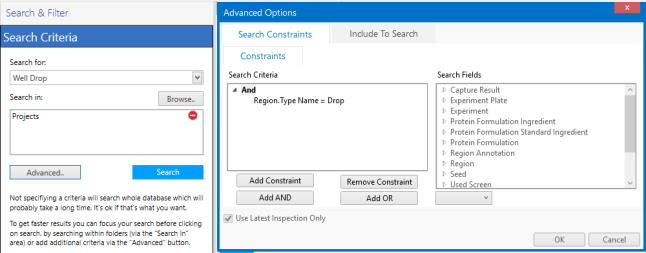
Search Constraint
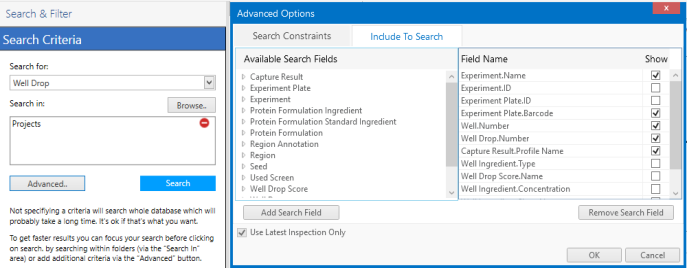
Include To Search
This portion of the screen contains multiple views for visualizing data, which are located on the following tabs:
The Graph tab displays a graphical representation of data found in the search results. You can interact with this tab to graphically display data according to your needs. For more information, see Graphs.
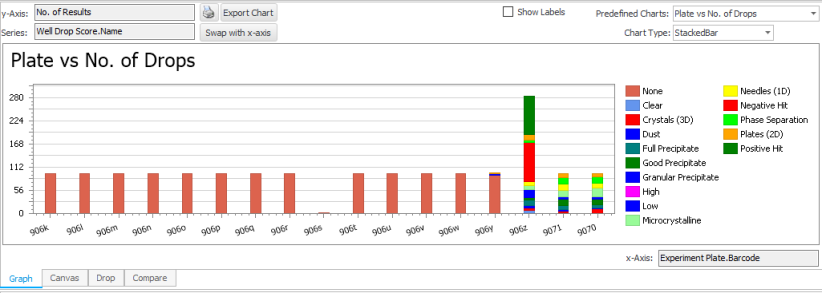
Graph Tab
The Canvas tab allows you to:
The Canvas tab is updated as you filter your search results.
The Drop tab shows you a high-resolution image of the currently selected drop. You can access this tab by double-clicking an image on the Canvas tab. When on this tab you can select a row from the result grid to show its respective image. For more information on the Drop tab, click here.
The Compare tab is used to compare different images side by side. These images can be selected from the canvas, up to four images at a time. When multiple images are selected, they are displayed in the Compare tab in a 2x2 layout. The Compare tab can be used to view images of inspections, regions, imaging settings or drops of different well drops. For more information on the Compare tab, click here.
Search Results is a table of results based on the Search Criteria and Search Filters.
The Search Results dock panel displays search results, grouped into pages of 1,000 entries or fewer. Columns in this grid can be added dynamically by dragging fields from the Search Fields panel to the Search Results. Fields can be removed by dragging them out of the panel. From this panel, you can:
Export search results to different formats
Copy search results to the clipboard

Search Results Table
Once search results are returned, the Instant Filter tab will automatically be enabled for you to filter the results. Two buttons will then appear: the Edit Filters button to narrow down your search results and the Apply Filters button to apply your selected filters. Besides these buttons, there are two options available: the Distinct Rows option to avoid duplicate records and the Enable All Filters option to enable or disable all the provided filters according to your own needs. The Instant Filters tab contains:
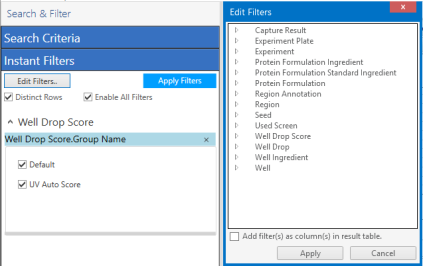
Edit Filters
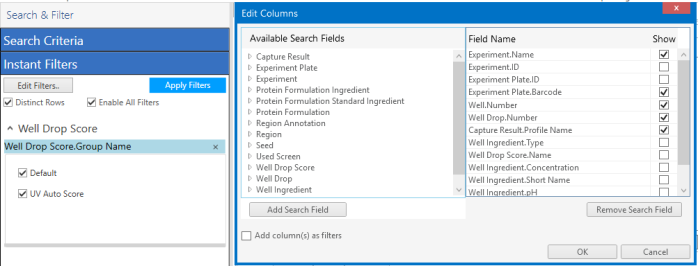
Edit Columns
 | |
| RMC-V313R018 |