
Rock Maker 3.10
Create a new seed layer in Rock Maker
Learn about Search and Filter with Rock Maker University

Automatic Image Management
 under Image Tools. Regions of Interest will be imaged by your system automatically, just like in Rock Maker desktop. For more information, read Drawing Regions of Interest .
Draw a Region of Interest in Rock Maker Web

Save Images from Rock Maker Web with the Scalebar and Conditions Table
Other Improvements
Added the ability to disable and enable users.
Added an option to open an experiment after the optimization process has finished.
Rock Maker Imaging Edition: Enabled copy/paste for the condition list layer for screens.
Rock Maker Web: Added the ability to compare drops.
Rock Maker Web: Added the ability to delete all of the Image Tools from an image by selecting the desired tool(s) and pressing the Delete key on the keyboard.
Rock Maker Web: Added actual inspection date to the navigator.
Rock Maker Web: Use F11 and F12 to move up and down the focus levels, just like in the desktop version.

Many of the best Rock Maker updates have been suggested by our awesome user community.
Have a great idea on how to make Rock Maker better? Let us know by contacting us at support@formulatrix.com!
Powerful Tools Added to the Well Tab. Experience the improved Well tab in the latest Rock Maker, which now contains many of the helpful tools already found in the Compare tab. Now you can view images as slideshow, give scores, markup your images with tools such as annotation and scribble, and save images directly from the Well tab. For more information, read Well, Drop, and Compare Tabs.
Save Hard Drive Space with Customized Importing of Focus Level Images. Rock Maker 3.9 enables you to choose when Focus Level images should be imported from Rock Imager. You can either choose to import Focus Level images for all images of a particular imaging setting, or you can import these images on a per-drop basis to save hard drive space. For more information, read Enabling and Disabling Import Focus Level.

Option to import focus level images in Imaging Settings
Improved Search Results in Search and Filter. There are several improvements to Rock Maker Search and Filter to help make this powerful tool even more useful. Now you can save multiple images at once, saving you time. The Compare tab also features several design improvements, such as titles for your images for easier identification. You can even view your search results as a slideshow, just like when you view images outside of Search and Filter. For more information, read Comparing Images from Search Results.

Saving multiple images from Search and Filter
Create Experiment Reports using Multiple Experiments. The latest Rock Maker release makes it easier to create an experiment report using data from multiple experiments, saving you time when you want to compare results. Just press CTRL on your keyboard and select the desired experiments from the Explorer. Then, right-click on them and select Experiment Report. This feature is also accessible from the Experiment Report button  in the Home tab. For more information, read Experiment Reports.

Easily create an experiment report from multiple experiments
Control Zoom Lock Available as a Global Preference. Now Rock Maker’s popular Zoom Lock feature — which enables you to set a zoom level that stays in place as you view different drops — is available in Global Preferences. If you enable this preference, Zoom Lock will be turned on by default so that you can set a consistent zoom level for each of these drops without having to enable the feature first. For more information, read General Properties.

Enable Zoom Lock in General Properties
Change the Slideshow Settings while in Slideshow Mode. This feature lets you adjust the slideshow settings directly from Slideshow mode, without having to open User Preferences. For more information, read Viewing Images in a Slideshow.

Change the slideshow speed
Set Rock Maker’s system memory (RAM) usage as a percentage(%). Rock Maker will now display memory (RAM) usage as a percentage instead of in number of bytes. This enables you to easily configure how much system RAM Rock Maker has access to. For more information, read General Properties.
Other improvements
- Pre-caching images in Drop View for faster viewing.

Image Interesting button
Improved Hits Report. Rock Maker 3.8 brings you improved Hits Reports with even more imaging data. Hits Reports now include the latest image of a given capture profile that was scored as a hit, even if the image was not part of the last imaging session. For more information, please read Hits Report.
 and the Hits Report from Rock Maker 3.7 (right)")
The Improved Hits Report from Rock Maker 3.8 (left) and the Hits Report from Rock Maker 3.7 (right)
Improved Slide show Viewing. The latest Rock Maker provides you with an improved slide show experience, displaying only wells that contain images. Now you can easily review your drops without having to pan through empty images. For more information, please read Viewing Images in a Slideshow.
Enable Optimization in Screens. The Optimization button is now available in Screen section, making it more convenient for you to create optimization experiments for existing screens. For more information, please read Creating an Optimization Experiment.

The Optimization button on the Screen Design tab
Other ways Rock Maker 3.8 can make life easier:
An “Allow searches under searches folder only” option is available in Miscellaneous Properties, which ensures that all of your saved searches will be kept in the Search folder.
When opening a plate, Rock Maker will open the last inspection of that plate instead of the last inspection of the whole experiment.
Updated the “Containers” label to read “Plate Types” in the Explorer. “Container Drops” was also changed to read “Plate Drops”.
Even Higher Quality UV Fluorescent Images. New UV images will be stored using a compression factor that yields even sharper images than before. This is especially useful for those images that are dark and require image tuning. By default your fluorescent Extended Focus Imaging (EFI) images will now be stored at full quality to ensure the best viewing experience. As a result, this will increase the image file size. You can revert back to the previous quality level by talking to your Rock Maker administrator.

Higher Quality UV Fluorescent Images
Rapidly Create Multiple Screen Experiments using Excel. Now create multiple screen experiments using a single CSV file. Easily design your screen experiments in Excel using our template (download here) including specifying imaging schedules, incubation temperatures and more. An optional barcode field allows users to create custom barcode labels or leave blank to have one automatically generated. The .CSV files are readily imported by clicking the Batchload Experiments button on the ribbon menu. For more information, please read Create Experiments in Batch.

Creating Experiment in Batch
Faster Performance for High Density Plates. We have further optimized performance for higher density plates by reducing the image load times to be similar to that of smaller plates.
Rock Maker Speed Performance Improvements. Rock Maker 3.7 includes significant speed performance improvements, designed to increase your efficiency. Everyday tasks have been made faster than ever so that you can keep working with minimal load times. The tables below show the load time reduction for common tasks executed in Rock Maker 3.7 as compared to those completed in Rock Maker 3.6. Please note that improvements will depend on the PC and network setup that you're using.
| Performance Times in Seconds for a single 96 well plate | |
| Task Executed | RM 3.7 Performance Improvements |
|---|---|
| Creating a New Experiment | 52.0% time reduction |
| Creating Protein Layers | 39.5% time reduction |
| Pasting an Experiment | 73.3% time reduction |
| Creating an Experiment Report | 27.0% time reduction |
| Performance Times in Seconds for a single 1536 well plate | |
| Task Executed | RM 3.7 Performance Improvements |
|---|---|
| Creating Protein Layers | 30.7% time reduction |
| Saving an Experiment | 70.1% time reduction |
| Pasting an Experiment | 84.8% time reduction |
| Deleting an Experiment | 64.0% time reduction |
Other ways Rock Maker 3.7 can make life easier:
Option to show the last username logged in.
Standardized options when saving images locally.
“Show confirmation dialog when moving any items in Tree” is turned on.
Your personalized Rock Maker experience awaits - Just log in. Rock Maker now saves you time by storing your personal preferences for future use, such as default plate type, color schemes, and default imaging schedule. Group preferences can also be used, allowing you to define what the default settings will be for everyone in your lab. To learn more, read Setting Up Preferences.

Personalized Rock Maker experience
Search and Filter is now easier to use. The Search and Filter interface has been redesigned to be more intuitive and user friendly than before. Now you can easily add parameters to new or existing searches to find the exact results you need without any hassle. For more information, read Search and Filter.

Search and Filter
Watch a brief video that highlights the new Search and Filter interface.
Drops in Hit and Instant Drop Reports. Hit and Instant Drop Reports now enable you to select which drops from the well to include in your results. This can allow you to focus your analysis on separate or similar protein formulations.
Relevant labels on your FRAP images. Labels for FRAP images are now more understandable. They changed from “Extended Focus”, “Focus Level 1”, “Focus Level 2”, and “Focus Level 3” to “Pre-Bleach”, “Post-Bleach”, “End-State”, and “Recovery Curve”.
Other ways Rock Maker 3.6 can make life easier:
Streamlined Imaging Tuning controls.
Fixed performance problems on the tree while opening folders.
Fixed memory leaks when using the slide show.
Many of the best Rock Maker updates have been suggested by our awesome user community.
Have a great idea on how to make Rock Maker better? Let us know by contacting us at support@formulatrix.com!

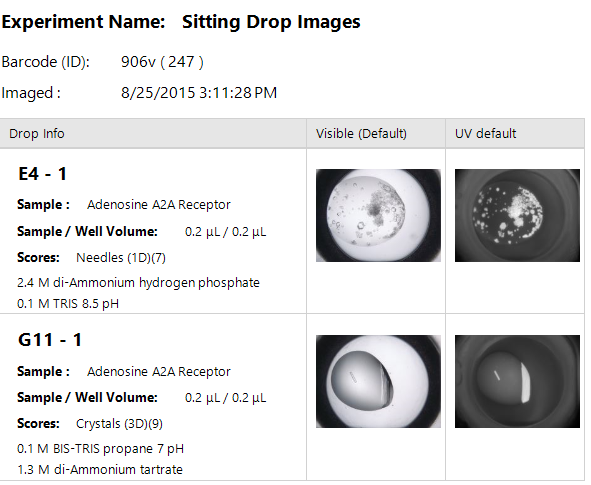
Single Drop Report
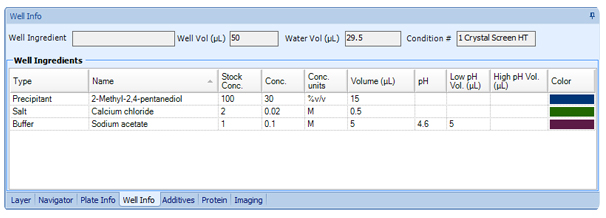
See scores and ingredient info in the Well tab. The Well tab now displays scores and ingredient info, making it a more useful view of the drops at a well. For more information, see Well, Drop, and Compare Tabs.
Stock ID added to Ingredient Info and Edit Layer side panels. The Stock ID, which is the same set of numbers that appears on a stock’s ingredient label, now appears both on the Ingredient Info panel’s detailed view and the Edit Layer side panels, so you can more easily see which stock has been included in your design. For more information, see Adding and editing ingredients.

Ingredient Info

Region of Interest
New “Tree: Follow Me” system property. A new system property has been added allowing you to turn off the Explorer’s behavior of highlighting the currently selected experiment, screen, protein, etc., as you switch tabs in the main workspace.
Larger drop labels. A colorful header appears on top of your drops showing you the scores, what type of image you’re looking at, which well and drop number you’re looking at, and so on. For more information, see Well, Drop, and Compare Tabs.

Drop labels
Display multiple images in the Hit Report. You can now include up to two imaging settings with the hit report, providing you with more detail in our most popular report to date. Read more about Hit Reports.
Hit report with visible and UV images
New Instant Drop Report. The hit report format is so popular, we made it into an Instant Drop Report! Now you can select some drops on the canvas and run an Instant Drop Report, which will provide you with the same type of report as the Hit Report -- no special score setup required!
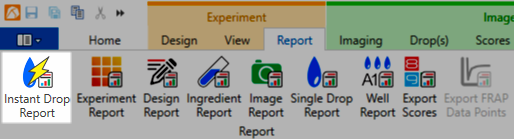
Instant Drop Report on Reports tab
Ability to score without images. You can now score experiments in Rock Maker even if you don't have images by setting the new "Scores: Allow scoring without images" system property to true (requires restart). Enabling this feature means that the images tab set and images view will appear when an experiment does not have images. Read more about scoring without images.

Score without images
Better concurrent license management. If your site has reached its maximum number of concurrent licenses and an additional user tries to log on to Rock Maker, they will now be shown a message along with a list of active users and the amount of idle time. If necessary, you can force log-off a user, or go talk to your coworkers to see who can sign out so that you may complete your work.
Select multiple incubation temperatures in the Screen Experiment Wizard. The Screen Experiment Wizard now includes an option to set up the same screen experiment at multiple incubation temperatures. Read more about the screen experiment wizard.

Select multiple incubation temperatures in the Screen Experiment Wizard
Export Full Recovery FRAP data points. FRAP users can now export FRAP data points used to create the recovery curve via a new button on the Reports tab (requires Rock Imager 2.15). Read more about exporting FRAP data points. Requires Rock Imager 2.15.

Export Data Points

FRAP Data Points Report
Assign default schedules to plate types. If you always use the same schedule with specific types of plates, you can simplify your design process by defaulting the schedule to a certain plate type using a new item on the Plate tab in System Properties. Read more about assigning default schedules to plate types.

Assign default schedules to plate types
Export charts from Search and Filter. Search & Filter charts can now be exported so that you can easily use them in reports, electronic notebooks, or presentations. Choose from a .bmp, .jpeg, or .png file. Read more about exporting charts from Search and Filter.

Export charts from Search and Filter
Optimize from Search and Filter. You can now create optimization experiments directly from Search & Filter results. Switch to the Canvas's design view, click one or more drops, and then click the Optimize button in the ribbon to create an optimization experiment. Read more about Search and Filter.
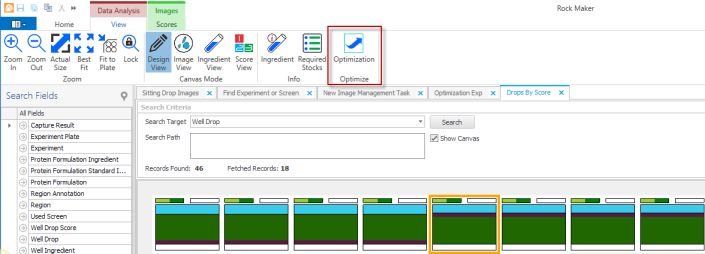
Optimize from Search & Filter design view
Delete experiments from Find Experiment or Screen results table. Right-click on one or more items in the results table, and select Delete to delete experiments right from the results table. This can be used to delete all experiments from users who no longer work for your institution. Read more about the Find Experiment or Screen tool.
Search for Expired Plates in image management. A new check box has been added to image management so you can easily search for expired plates in the interest of deleting unnecessary images. Read more about image management.
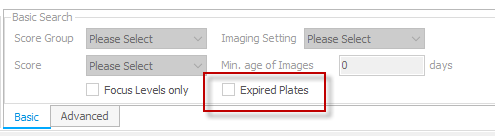
Expired Plates check box in image management Basic Search box
Set slideshow images to traverse the column or row. There's a new control on the slideshow control bar that allows you to switch from viewing images across a row, to down a column. Read more about viewing images in a slideshow.

Slideshow controls
Better Usability
Optimize by dragging wells into a folder. Previously, you could only create an optimization experiment by dragging a well or wells into a project. Now, you can drag the wells into a folder (as long as the folder is under a project). Read more about creating an optimization experiment.
Improved imaging tuning on the Compare tab. We’ve made it easier for you to adjust image brightness and contrast when you are working in the Compare tab -- Rock Maker will show you which image you are manipulating by highlighting the image in an orange outline. Read more about Image Tuning.

Tuned images
Optimization and dispensing tutorials added to Rock Maker University. Rock Maker University has two new tutorials! In the grid optimization tutorial, Rock Maker teaches you how to take one or more wells and create a grid optimization experiment. If you’re an NT8 user, Rock Maker will now walk you through how to properly set up an NT8 dispense. Read more about Rock Maker University.

Grid Optimization
New navigator display preferences. With the new Navigator Preferences, you can choose to show the newest images first on the image timeline, and elect whether to display timepoints in days and hours, or hours only. Read more about setting navigator preferences.
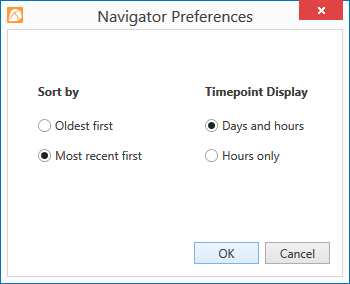
Navigator Preferences
Hide unused stocks and ingredients.
A new Active column has been added to the Stocks table on the Edit Ingredient window. By default each ingredient will be Active. You can clear the check box to make an ingredient inactive, which hides it from the stock selector during the experiment design process. Read more about adding and editing ingredients.

Active column
Save all open experiments. You can now save all open experiments at once! The Save All button is available both on the quick access menu and on the application menu, or you can use the CTRL+SHIFT+S keyboard shortcut.

Save all open experiments
Multi-select in Find Drops. You can now multi-select in find drops results! Choose multiple ingredients or scores to show the related drops on the canvas at once. This selection works as an "or", so if you select multiple ingredients, your results will include items with any of those ingredients. Read more about finding drops in a plate.

Multi-select in Find Drops
Choose whether to show ingredient long names or short names. You can now opt to display ingredient short names instead of the long names by configuring the new system property “Ingredient: Show Long Name”. This property affects all panels that display on the right of the Canvas.
New notifications to prevent imaging errors.
We’ve made a few changes to help make the Rock Maker - Rock Imager connection easier to use and understand. Firstly, when you ask Rock Maker to print a label for a plate, Rock Maker will now notify you if any of the wells at the plate do not have a protein assigned. Rock Imager will not image wells that do not have both well ingredients and a protein assigned. Secondly, if you attempt to run an “image now” command, Rock Maker will tell you if a plate when a plate is not in Rock Imager storage and therefore cannot be imaged. Thirdly, text will display above the Imaging Schedule if plate is not inside an imager to alert you as to why it is not being imaged. Read more about Image Now.

New notifications to prevent imaging errors
New navigator strip. We’ve updated the navigator strip (at the top of your drop images) to match the rest of the application. Read more about the Navigators.
Convert experiments to screens with a single mouse-click. If you have designed an experiment that you want to use in multiple experiments, the best thing to do is convert it to a screen, and then drag the screen to each experiment as needed. This button has been added to the Tasks group in the Design tab for easy access.

Convert To Screen button
Color coded ingredients in design view ingredient info panel. Colors on the canvas are now directly mapped to the ingredients in the ingredient info panel when you are in design view, so you can quickly see a visual representation of how different ingredients make up the contents of a well.

Ingredients Info
New icon in the Explorer for experiments in design phase. We’ve added a new icon to the Explorer to indicate experiments that are in the design phase -- not yet dispensed, and not yet imaged. The icon looks like a pencil on top of the existing experiment icon. Read more about Explorer icons.

Experiment in Design Phase icon
Create an Optimization experiment with a few mouse clicks
Click a well, or hold down the CTRL key and click to select several wells -- then click the Optimize button and Rock Maker will walk you through setting up an optimization with either a grid layer or a random layer. For more information, see Creating an Optimization Experiment.

Optimization Experiment
Hit Report
Once you have configured which scores denote a hit, you can create a Hit report on any folder, experiment, or project from the Explorer. The Hit Report will tell you which ingredients contributed to a hit, how many times those ingredients appeared across all hits, the pH and concentration ranges that contributed to a hit, and then show you the Visible (Default) image of each drop that was scored as a hit. Read more about Hit Reports.

Hit Report
Clear scores with hotkeys
Accidentally scored a drop? No problem -- press the hotkey a second time to remove the score you just added to the drop. You can also remove a score by clicking the score in the Score ribbon.
Visual and auditory notifications when you reach the last drop on a plate
Rock Maker now notifies you when you've reached the end of a plate, so you do not have to catch yourself viewing the A-row drops twice.
Well Ingredients added to Score Report
Our score report now includes well ingredients, so you can scan for trends among high-scoring drops.

Well ingredients on score report
Custom Prefixes and Suffixes in the Screen Experiment Wizard
The Screen Experiment Wizard now allows you to add custom prefixes and suffixes to your experiments.

Prefix and suffix options on the Screen Experiment Wizard
Stock Location added to Ingredient Properties
We've added a free text field called Stock Location to the Stock table in Ingredient properties. Use this field to type in the location of the stock. The location of each stock will print out with the Dispensing Instructions so you can quickly locate the required stocks at your facility and load them into your liquid handler.
More Specific Image Now buttons
We've made the Image Now buttons more distinctive, so you can tell if you're imaging just a single plate in a multi-plate experiment, or the entire group of plates.

Image Now buttons
Favorite and Prepared stock filters in the stock selector
See your prepared and favorite stocks in the stock selector by selecting either Favorite or Prepared from the stock selector list.

Prepared and Favorite filters in stock selector
Locate the active Experiment in the Explorer by clicking a button
Large database, several open experiments, and not sure where in the Explorer the active experiment is? Click our GPS-style button and Rock Maker will show you where the active Experiment is in the Explorer.

Locate button on the Explorer
New images now indicated with bold text
If an experiment has new images, the text will now display as bold until you view them -- no more green and red check marks.
Dispensing tools moved to the Home ribbon
In the interest of simplifying in the Explorer, we moved the Dispensing tools to the Home ribbon.

Dispensing group on Home tab
Best fit button added to the View bar
You'll see a new button to the right of the zoom slider on the Viewbar. Click it at any time to bring the Canvas back into Best Fit view.

Best Fit on View bar
Delete layers from the Layer Gallery
You'll notice small red delete buttons on your layer icons in the layer gallery. Point your mouse at the X and it will change color; click the X and you can now quickly and easily delete a layer.

Delete layers from the layer gallery
Ingredient Info panel replaces Well View
You asked, we listened -- Well View has been replaced with Ingredient View, for an easier-to-read presentation of drop ingredients.
New Icons
You'll see several reworked icons throughout the software, which we hope are more intuitive.

New report icons
Image Tuning on the Image Tools tab
Image Tuning has a new home -- on the Image Tools tab. Access all the most-used tools from one tab.

Image tuning on the Tools tab
Access Image Tools by right-clicking
Viewing an image and want quick access to the ruler tool? Right-click on the drop and all Image Tools are at your disposal.

Right-click menu with Image Tools
Refined Well View
If you have protein in drop 1 and drop 3 of a 3-drop plate and you like to view your drops in well view, you'll now see larger images of your drops when using Well View. Two images instead of three drops with a blank image in the middle in order to provide you with larger drop images.
An easier way to copy and paste layers
We've added several tools to the Layer ribbon so you can select a layer, then click either the cut, copy, paste, or paste as a linked layer in order to make it even easier to design and edit your experiments.

New layer command buttons
Standard keyboard zoom shortcuts
Use your keyboard to zoom in and out on the plate. CTRL+PLUS SIGN is zoom in; CTRL+MINUS SIGN is zoom out; and CTRL+0 is best fit.
Rock Maker Web refresh
Rock Maker Web has been redesigned to a more modern, useful web application that's faster and provides better performance while viewing Rock Maker images. You can also now create rulers, draw scribbles, create annotations and define regions of interest. If you are interested in a Rock Maker Web demo, please contact sales@formulatrix.com.

Rock Maker Web
Flexible Explorer width is back!
The Explorer (a.k.a. "tree") width is flexible once again. You can move it to whatever width you like and Rock Maker will remember your sizing preference.

Rock Maker Explorer
Labeled Region of Interest boxes
Region of Interest (ROI) boxes now include labels to show you which imaging type is related to which box. These boxes show you the imaging area possible with the limitations of each specific lens.

Labeled Region of Interest boxes
Lock zoom while on the Compare tab
You can now set a zoom on a drop and "lock" it, which means Rock Maker will hold the zoom settings as you view subsequent drops on the plate.

Lock zoom while on the Compare tab
Lock zoom during a slide show
Rock Maker now allows you to set a zoom preference and keep it while viewing each drop on the plate, instead of resetting the zoom to show you the entire image for each new drop.

Lock zoom during a slide show
Clear manual drop location ROIs from Rock Imager
If you've manually set the drop locations in Rock Maker for an LCP plate, you can now delete them all at once from Rock Imager. See the Rock Imager help file for more details.
Clear all ingredients from Rack Editor
Now you can conveniently clear all the ingredients from the Rack Editor at once. Simply right-click while in the Rack Editor and select "clear all ingredients".
![]()
Clear all ingredients from the Rack Editor
Rock Maker 3.1 is the subsequent release to Rock Maker 2.9, as Rock Maker 3.0 was only released on a limited basis. 3.1 is a big step away from 2.9, however, so if you have no upgraded since 2.9 it is strongly recommended that you read the Rock Maker 3.0 what's new content (below) and watch the introductory video.
Rock Maker 3.1 offers many small, but significant usability enhancements over Rock Maker 3.0, which was released in a limited fashion to customers willing to move to the first iteration of Rock Maker’s redesign. For those of you upgrading from Rock Maker 2.9, be sure to read through both the 3.0 and 3.1 what’s new summaries, and make sure to watch the 3.0 introduction video on our website.
Multi-Select in the Explorer
Due to popular demand, Rock Maker 3.1 features multi-select in the explorer, a.k.a. “tree”. Press the CTRL key and click on different experiments, then drag them to a different folder or right-click to reveal commands that apply to each selected item, such as copy, delete, move to dispense queue, mark as dispensed, mark as not seen, and change schedule.
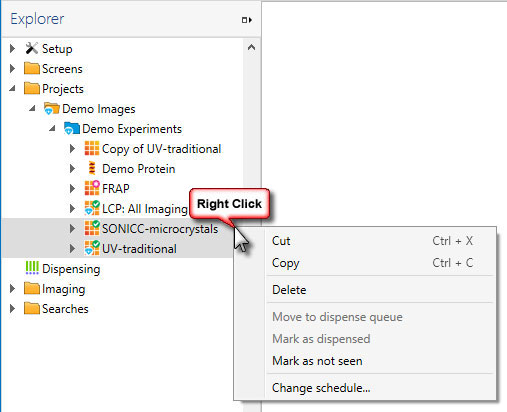
Example of selecting three items and right-clicking on the Explorer.
New icons in the Explorer
To make the Explorer look cleaner and start to match the rest of our software's look and feel, we've changed the icons. You can see the new plate state icons here.
![]()
New Explorer icons
See experiments that contain hits from the Explorer
You can now configure which scores indicate a crystal hit when setting up scores, and then Rock Maker will automatically display a special symbol on the plate, experiment, or folder when a plate contains a drop that has been scored as a hit:  .
.
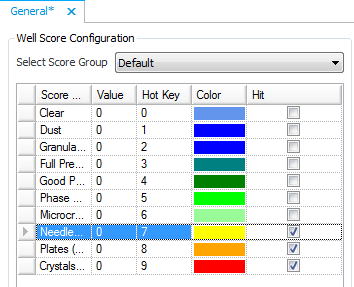
The diamond icon indicates that the experiment has a score configured as a hit.
Easier-to-use Stock Selector
The stock selector has been redesigned so that selecting low pH and high pH buffer stocks is a more obvious process. The current field is also indicated with a blue highlight.
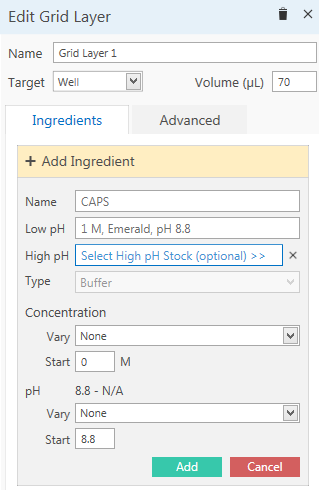
New stock selector.
Rename and Delete Screen Experiment Wizard templates
Template management has been improved in Rock Maker 3.1. You can now rename and delete templates through a right-click menu available in the template list.
Score Report
Looking for an easy way to get an experiment’s scores into your lab notebook? Now Rock Maker can generate a score report from your scored drops. The report is a .csv file that contains every score assigned to each drop in your experiment.
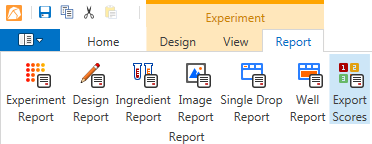
Export Scores button on the Reports tab.
Required Stocks List
Want to see a list of every stock included in a plate at once? Now you can. Click the Required Stocks button in the Info group on the View tab.

Rock Maker 3.0 brought many visual changes to Rock Maker. It represented months of planning and many long days of development work, so we hope you like it.
Here's what was new in 3.0e=:
More readily-available Rock Maker commands
Rock Maker has become quite powerful over the years, and as a result many features have become hidden or buried under right-click menus. So, we decided to overhaul the software to bring all of Rock Maker's power and flexibility to the forefront. When you first start Rock Maker 3.0, you will notice a lot of change. Instead of using right-click menus, toolbars, and regular menus, you will use the ribbon to find the commands you need and tools you use. Commands are organized into tabs, and then further organized into groups. Some tabs only appear when they are relevant. For example, you will only see tabs related to images if an experiment has images. Don't worry -- many commands are still available through right-click menus to help you with the transition. In addition, information that used to appear in tabs at the bottom of Rock Maker now appears as needed in panels at the right of your screen.
Read all about the new software in the Rock Maker Software section of this help file. You can also learn where all of your most-used functions are by going through some of the latest tours in Rock Maker University.

New Rock Maker ribbon
Generate several experiments at once when screening a protein formulation with the new Screen Experiment Wizard. You can even save your settings as a template in case you have a favorite set of screens you like to use. Learn more about the Screen Experiment Wizard.
![]()
Screen Experiment Wizard
Quick access to recent documents
Quickly find the experiments, proteins, and documents you've been working on with Rock Maker's new Recent Documents list.

Recent Documents
If you open the Scheduling control panel from the Explorer, you will see a new Priority column after the Notify column. You can adjust priority to fit your needs on a per-inspection basis -- assigning a priority of 1 means that an imaging session will take precedence over any other scheduled sessions in Rock Imager's imaging queue. By default, earlier inspections are assigned highest priority, and Image Now always gets the highest possible priority.

New priority column
New Search and Filter graph: Protein Formulation Concentration vs. Number of Hits
Visually identify the concentration that a protein formulation produces hits at with our latest addition to the Search and Filter graph options.

New Search and Filter chart
Imaging Settings are the new Capture Profile
In order to make Rock Maker easier to understand for new users, we've renamed some of the terms used in Rock Maker. "Capture Profiles" are now called "Imaging Settings".
Option to turn off Autoscoring
If you have UV or SONICC imaging, you can now disable Autoscoring. See Enabling and Disabling Autoscores for more information.
See all of your capture profiles and inspections in a single glance with Composite View
We’ve added a new view to the Image Navigator to make it easier to find special inspections and capture profiles and to see all of your image, drop, capture profile, and inspection options at once. The view you are familiar with in the navigator is still available and is now referred to as “Thumbnail View”. “Composite View”, shown below, is accessible by clicking a button at the top-right of the Image Navigator.
To see images of a specific kind taken during an inspection, simply click the camera button  . For more information, see Navigators.
Learn basic tasks using Rock Maker University
You’ll notice a new button on the toolbar in black and white -- this button is your doorway to Rock Maker University. Rock Maker University will teach you how to perform common tasks in Rock Maker while you do it -- for example, the “Creating a Protein Formulation” tutorial actually walks you through the steps of creating a protein formulation, and at the end of the tutorial you have a protein formulation to use in your experiments. 
Please note that this release of Rock Maker University is a preview. We will continue to build out the tutorials and tours. If you have ideas for scenarios or parts of Rock Maker that you would like put into this kind of tutorial format, please email hannah@formulatrix.com.
Image drops on demand
You can now initiate an on-demand imaging session for individual drops directly from the Canvas or from the Drop tab. Simply select the drops, right-click and select "Image Drops Using", then select the desired imaging capture profile(s) and click OK. You can also image plates from the right-click menu on the Explorer. For more information, see Creating On-Demand Imaging Sessions.
See more exact imaging areas when drawing Regions of Interest
Since there are different imaging parameters for visible, UV, FRAP, and SONICC imaging methods, some of you may have noticed that a region of interest you created on a drop imaged with visible light returns a slightly different length and width when imaged with UV. If you are a customer that uses multiple imaging methods, you will notice that the ROI tool now shows several different colored boxes at once. These represent the actual obtainable area for each imaging type, programmed to your specific imaging capabilities -- if you have fixed zoom options, for example, the boxes you draw will "snap" to different sizes as you attempt to draw the ROI. For further instructions, see Drawing Regions of Interest.
Customize imaging schedules with a single click of the mouse. If you’re setting up a project or experiment and working on the imaging schedule, you can now customize the schedule without right-clicking. Simply check a box and a message will appear asking you to confirm that you would like to customize the imaging schedule, then continue customizing the schedule. For further instructions, see Creating an Experiment.
Choose which drops to image by typing in their well locations. You can now control imaging on a drop-by-drop basis with the new "Select well(s) by name" feature. This feature is accessible from the Tools menu, and is also available by right-click. Just type in the well numbers associated with the drops you want to image (separated by commas or spaces) and click OK.
Refresh the Explorer to instantly show changes made by colleagues. The Explorer now includes a refresh function, helpful in workgroup situations. Simply click anywhere on the Explorer, then press F5 on your keyboard. For more information, see The Explorer Tree Tab.
Sample Searches in Search and Filter. In an effort to make Search and Filter easier to use, we have included three sample search and filters for you to use and learn from. You'll notice a new "Sample Searches" sub-folder in the "Searches" folder. Then, choose "Drops vs Ingredients", "Drops vs pH", or "Screens Used in Experiments". For further instructions, see Using Sample Searches.
Usage Report Option. The Usage Report allows Rock Maker to send a log file containing information about how you use Rock Maker to usability@formulatrix.com. Enabling Usage Statistics will help us determine where the develop features, and when to retire features if they are no longer useful to you. To opt in, go to Setup folder on the Explorer and double-click the "General" node. Then, select the check box next to "Help make Rock Maker better by automatically sending usage statistics to Formulatrix". For more information, see Usage Statistics.
Drop Location Mode. Drop Location Mode allows you to draw drop location boxes for multiple drops while moving around your plate on the canvas. For more information, see Viewing and Setting Drop Location.
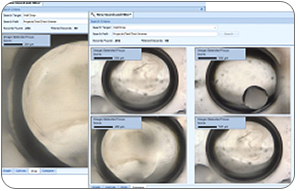
The ability to compare images directly from Search and Filter results
In previous versions of Rock Maker, the only way to compare images from Search and Filter was to select the wells from the Canvas: The Workspace tab. Now, you can tell Rock Maker to display images on the Compare tab simply by pressing and holding the Ctrl key on your keyboard while selecting individual rows from the search results table. For more information, see Comparing Images from Search Results.
The ability to search for images without scores
You can now set an “is null” search constraint to the well drop score in order to see a list of all images that do not have scores. You can then either score the images, or delete them if you are trying to “clean up” experiment results and wish to save disk space. For more information, see Searching for Drops without Scores and Deleting Images.
The ability to tag drops as interesting
You can now tag certain drops as "interesting" in Rock Maker, and instruct Rock Imager to image only those drops on a plate (requires Rock Imager 2.10). For more information, see Tagging Interesting Drops.
New FRAP Capture Profiles
Rock Maker 2.8 introduces revamped FRAP capture profile settings, giving you greater control over fluorescence (Cy3 ) imaging mode, bleach options, FRAP post-bleach options, imaging options, and curve fitting options. For more information, see Using FRAP Capture Profiles.
Close Tab button added to each tab
Previously, the only way to close a page in Rock Maker was to click the “X” all the way at the top-right of the workspace. Now, you can click the X right next to the name of the tab.
Support for Windows 8
In support of cutting-edge technology enthusiasts, Rock Maker is now compatible with Windows 8.
Performance enhancements for experiments with large number of wells
If you set up experiments with multiple 96 well plates or work with 1536 well plates, you'll notice much faster response times when viewing images and switching between different experiment views.
An easier way to unlock and edit locked experiments
Previously, the only way to unlock a dispensed experiment and begin editing was through a right-click menu. Now, you have the option to unlock the experiment and continue editing right from the warning message that appears after an attempt to drag-and-drop an ingredient to the locked experiment. For more information, see Editing Dispensed Experiments
Empty drops automatically skipped on Drop tab
Tired of viewing empty drops when navigating the drop tab? Rock Maker now automatically jumps to the next drop with an image when you're moving through drops with your keyboard.
More information available on the Imaging tab
We've added several new states and the identity of the source to the Imaging Schedule table on the Imaging tab.
Support for Rock Imager Auto Score
In support of Rock Imager's score scoring capability (introduced in Rock Imager 2.9), Rock Maker 2.7 displays these auto scores in Image View.
The examples below are UV-TPEF images acquired with a SONICC imager. Mousing over the score in Rock Maker displays basic information about the score's origin, e.g. "UV-TPEF Auto Score: Positive Hit".
Note: Auto Scoring is only available with Rock Imager 2.9 and either UV imagers or SONICC imagers.
You can also use auto scores as a Search and Filter parameter.
For more information, see Auto Scores.
Score information tool tips
Hovering over an auto score with your mouse now displays related information in a tool tip, helping you identify which imager registered the hit or miss; what the manual number score means, and so on.
For example, if you configured a hotkey score of 3 to signal a drop showing a full precipitate in General Setup, mousing over the 3 would display: "Manual Score: Full Precipitate". This capability is particularly useful with auto scores if you have both SHG and SONICC imagers and the imager default is SHG light.

Interface changes
To support the new Auto Score functionality and to add flexibility to Compare View, we expanded the toolbar to include five new buttons.

“Auto Score Highlighter” outlines each drop in green, yellow, or red to represent positive auto score, mixed scores, and negative scores. “Auto Score Filter: All Hits” shows you only drops that were scored as a positive by all auto score-capable imagers. “Auto Score Filter: Any Hits” shows you drops that were scored as a positive by any auto score-capable imager.
Additionally, there is a new Auto Score tab that allows you to change the thresholds for positive and negative hits. If you do not have a UV imager, the UV auto scoring controls are grayed out, as shown in the image below.
Slideshow view
Experiment images can now be displayed as a slideshow. Slideshow controls include play, pause, previous, and next controls. You can also score your images while viewing the slideshow with the associated keyboard hotkey.
You can now view side-by-side comparisons of drop images from different inspections or capture profiles on the Compare tab. The image at right shows a comparison of a default image with an Ultraviolet image from a different inspection.
For more information about comparing images, see Comparing Images from Different Captures and Inspections.
Don’t remember how an image got a certain score? No problem. New image score symbols convey whether an image score was inherited from a previous inspection, automatically assigned by an imager, or manually assigned by you.
Scores you assigned manually appear in the normal fashion. Scores that were “inherited” are now outlined in the previous score color. “Inherited” means new images have been taken since you last scored the drop. Images with scores assigned by an imager (i.e. FRAP) display with a small black triangle in the upper-left corner.
For more information about scoring images, see Scoring.
Previously, you could only access the Image Toolbar when viewing images from the Drop tab. Now you can freely define regions of interest, draw, scribble, annotate, and measure parts of your image directly from the Compare tab.
For more information, see Image Views.

Don’t want to use certain capture profiles? No problem. You can now enable and disable capture profiles by checking or unchecking the box in the Enabled column from the Capture Profiles page, removing possible confusion when configuring imaging schedules on a project or experiment level later on.
For more information, see Capture Profiles and Image Scheduling.
Speed up the imaging time by turning off image captures for certain drops and feel free to change your mind later; you can now enable and disable imaging on a drop-by-drop basis. A red slash button (see buttons outlined in green) indicates that imaging has been disabled for a certain drop.

For more information, see Assigning Capture Profiles to a Drop or Region of Interest.
Free up disk space and keep important images. You can now exclude the first and/or last inspection of a project or experiment by checking the appropriate box on the Image Management Task page.

For more information, see Image Management.
Want your imager to focus on a particular area of the drop at a specific zoom level with a single click of the mouse? Done. We’ve added a new button to the toolbar, as shown below.

For more information, see Image Tools and Using the Image Toolbar.
You can now include the zoomed-in version of an image in your printed reports. Simply click the checkbox next to the new “Use Current Zoom” field beneath Single Drop Report Options.

For more information, see Reports and Printing a Single Drop Report.
Rock Maker is now better integrated with Rock Imager. If you create an experiment via Instant Imaging in Rock Imager, Rock Maker automatically adds it to a new Instant Imaging folder in the Projects node of the Explorer tree (see right).
Note: Requires Rock Imager 2.8 or newer.

For more information, see The Explorer Tree Tab.
Rock Maker now automatically displays date and time settings where appropriate according to your computer’s date and time settings.
Analyze your data with the following powerful and new charts: Project vs No. of Drops and Protein Concentration vs No. of Drops.

Read more about Search and Filter charts.
Right click on any node of the tree, select Analyze and the query that you're interested in. The query will automatically run within the scope of the selected node.

Read more about the Steps to Perform a Search and Filter.
You can create Search & Filter queries in any folder and move them from folder to folder. This will give you easy access when you have queries that make more sense for certain projects or when your folder organization is set up by team.

You can launch an experiment and drop report directly from your results.

Read more about Single Drop Reports.
If you want to filter your results by a used screen, select the Used Screen field. Alternatively, this can be used to see the specific screens used in each wells within the results grid.

Read more about the Search and Filter.
You can view and give your scores in multiple experiments through the Search Results box. You must make sure that you have set the Well Drop Score Name to show by right-clicking in the Search Fields box and select Show.

Read more about Scores.
Now, when you store your queries, the whole context of the search will be stored, including the chart and filters.
You are now able to change the design of an experiment after it has been dispensed or imaged. This changing has to be handled with care as you might lose traceability. That is why a warning appears before entering this mode. Lab administrators are also able to turn this functionality off if they deem it too dangerous.

Read more about Update Experiment and Screens.
Drag your protein anywhere in the canvas and Rock Maker will add it to the layer where you dropped it. As you hover over the wells, the destination drop will be highlighted.
Read more about Designing a Protein Layer.
See the capture profile’s actual configuration values at the time of image capture. This is only available with Rock Imager 2.8 and later. 
You can now disable the imaging of a region without deleting the region definition. You can re-enable imaging later.

Read more about Region of Interest.
You can run a report for multiple experiments. The current experiment will be selected by default; you can add additional experiments if you want to. Similarly images from the current and additional capture profiles can be included into the report.

Read more about Experiment Report and Single Drop Report.
Image management jobs now happen in the background allowing you to continue to do other work in Rock Maker. You are able to view the progress of the job via a live report.

Read more about Executing an Image Management Job.
 Search your database quickly and effectively with the improved Search & Filter. Rock Maker returns results faster than ever and is now able to search larger databases that were previously impossible.
Determine which screens are most likely to produce crystals quickly and easily with visual analysis of the new Screen Hits chart. Just another way Search & Filter can break down your data and provide answers in just a few seconds.

Identify the state of your screens, experiments and plates with the new status buttons in the Tree. These buttons tell you at a glance whether a plate has been designed, dispensed, imaged, viewed and whether it has expired.

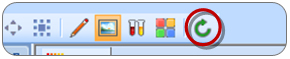
Stay up to date with the latest versions via automatic update. Rock Maker can check for new releases at start up, or you can manually initiate a check at any time from the Help menu.

Tidy up your image library with the intuitive interface. Simply specify a scoring criteria and age (in days) of the images you want to move or delete.

Import screens with ease using our newly streamlined Screen Import tool, which guides you through the process and helps you to resolve ingredient conflicts.

Copy protein drop and well contents from the Plate Info tab of one experiment, then paste them directly into another. You can also generate a single drop report of one or more wells directly from the Plate Info tab.

Inspect your drops with the high resolution images using the drop canvas. The Compare view allows you to compare up to 4 drops, whether they are on the same experiment or not.
See the ingredients that compose any selected item on your result via the standard Well Info, Protein and Additive tabs – all without leaving your search.
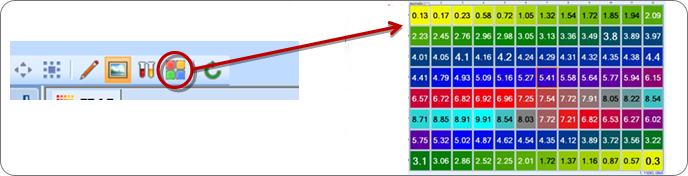
A new plate view (besides Design, Ingredient, and Image views) has been added to show image scores. This helps users get a better view of scores for all images at once. In case of manual scores each score is represented with a hotkey and designated color. Color gradation is used to represent intermediate values (for example if 0 is assigned the color yellow and 2 is assigned the color green, the value 1.05 will be represented by a shade of yellow-green, as seen below.)
Scores can now be numeric, suitable for automated scoring processors such as FRAP, our first processor that quantifies protein mobility in LCP plates.
Users can refresh their image view and see new images as they arrive from the imagers without having to reopen the experiment.
Users can now export images and import them into any Rock Maker database, enabling them to easily share their work with users at different labs.

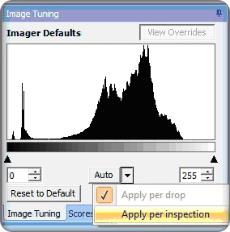 Auto
AutoAuto-leveling now has two working modes: “Apply per drop” and “Apply per inspection”.
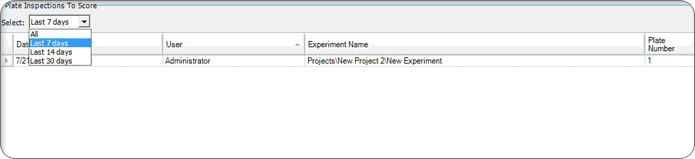
This drop-down menu in the Scheduling tab offers easy access to a list of plates that have been recently imaged and are waiting to be scored.
Rock Maker’s search functionality has been completely overhauled with more powerful data search and analysis functions. These brand new features make your data search fast and effective. Now a user can simply identify search criteria from a list and quickly drag and drop to narrow the search without any additional commands or filters. There are dozens of viewing options (charts, lists, etc.) that can focus and expand on selected items for data mining. Finally, to ensure your data analyses efforts are robust and versatile, Rock Maker now allows you to compare information across multiple experiments instead of being bound to just one at a time!
Data analyses efforts have now become interactive and hands-on – allowing the user to have full control of what information is displayed, and exactly how it is displayed. Now you can analyze and compare data using interactive pie charts, 3d bar graphs, data lists (to name just a few!) to set up fast and easy data mining efforts.

You can now view a report of plate movements by using Event Log. Simply go to File > Reports > Event Log to open dialog box on picture below. Define start and end date of plate movement you wish to view, then you can also export this event log by click on Export to File, save the file (.txt format) and open it using notepad.

Drag and drop fields let you narrow your search to eliminate sifting through insignificant information. The overhauled controls make the selection and setting of values for search criteria much more efficient than previous versions.

Now you can customize what data is displayed by Rock Maker by dragging the desired fields into the display columns as pictured below.

You can now display the data in the design view, the ingredient view, and the image view - just as you would elsewhere in Rock Maker.

With fully interactive 3d charting of compiled data, you can now get a much clearer picture of your results. A 3d chart lets you rotate and zoom to map out and precisely compare results to obtain more valuable information.

 Image tuning
Window Leveling is a new image processing tool added to Rock Imager and Rock Maker that dramatically enhances UV imaging in the following ways:
Rock Maker now allows you to adjust the histogram of an image through the Image Tuning tab. The Image Tuning tab provides controls to tune images for better display.
 For quicker access, the designer, image, and ingredient view modes on the canvas can now be accessed directly through the toolbar. These used to be located on the right-click menu of the canvas. Additionally you can cycle through these views using the shortcut key F4.
 Rock Maker now provides useful tips at startup. Random tips on how to use Rock Maker features are available whenever you run the Rock Maker software. This helps you to easily get better understanding about the Rock Maker features.
Rock Imager (Multi Imager) now can check last image that viewed using different cameras. Go to Imager on menu bar and you can select available options, view last image (CTRL+1) to open image that last viewed. The image that displayed will appear using three cameras, visible, ultraviolet and SONICC.
You can now customize the Rock Maker user interface organization by repositioning tabs, resizing panels, converting a panel into a floating window, and moving panels to a different area in the user interface. This gives you more flexibility to arrange the application panels as desired. Any settings you have made will be saved and used whenever you open the software in the future.

Rock Maker now allows you to set different schedules for each different capture profile, both at the global and experiment levels. For instance, you could set the imager to use UV imaging on the 3rd and the 7th day of an experiment, while visible light imaging is set to image daily.

Rock Maker now allows you to search ingredients in the setup section. Searches are live and the results are updated as you type. This process is much faster and saves time in finding the ingredient name.

Both Rock Maker and the Rock Imager software allow you to manage the number of plates that can be stored in the Rock Imager storage hotel based on groups, by setting quotas to those groups. If a limit is reached, then additional plates belonging to that group will not be able to be stored. Quotas are optional.
This feature enables users to copy a single layer or a selected well from the canvas and paste them in MS Excel, MS Word, or Notepad.

This feature enables users to search experiments or screens using a simple text search to find matches in any of the various screen/experiment properties, such as experiment name, barcode, experiment notes, plate name, etc.

All grids in Rock Maker can now be exported to MS Excel, MS Word, Notepad, or as an XML spreadsheet.

Now Rock Maker will be available in three different editions:
This new integration feature allows Matrix Maker users to export experiment data into an XML format that is compatible with the XML Import in Crymon.

Rock Maker no longer needs administrative privileges to run on Windows Vista and Windows 7.

The Plate ID has been added to the Rock Imager Processor log files.

 Export image management results
Users can now export the results that appear in the Image Management window. The results can be exported into .csv, .xml, or .txt formats. To do this, right-click anywhere in the table and select "Export..."
This integration enables users to import images of drops created by Crystal Farm Imagers directly to Rock Maker.
This integration enables users to import ingredients from Crystal Track's xml format into Rock Maker. It also enables Rock Maker users to export their screens and experiments into an XML file that can be read by Crystal Track.

This feature enables users to provide concentration values for each well in experiment manually through a spreadsheet for Grid Experiments. When "Custom" is selected for concentration values, a spreadsheet will open that displays a similar configuration as that of the experiment. User can enter values manually and/or apply formulas to calculate them. When user closes the spreadsheet, the values are transferred into Rock Maker and shown on the canvas.

This new functionality will enable the user to drag ingredients from the ingredient list directly to a layer on the canvas. User can opt to either add the ingredient to an existing layer (if there is only one layer used in the experiment) or select the layer from a dialog (if multiple layers are used in the experiment).

Users can now modify some of fields in designed experiments after they are dispensed. The user is allowed to change the following after an experiment is dispensed or marked as dispensed: Setup Temp (*C), Incubation Temp (*C), Reducing Volume, Notebook Page #, Owner, and Date Dispensed.

 Using prepared stocks
This new prepared stocks functionality will allow the user to replace currently employed stocks with ones that are marked as prepared ones in a particular condition.
 Concentration units in drop down
Concentration units can now be selected from a drop down menu while creating ingredients. These units can be configured through the system properties in Rock Maker.
 Drop info tooltip
The drop info tooltip shows information related to the protein layer and any associated drop additives. Hold your mouse over any drop on the canvas to display
.
This is an option allows the user to send a test email to support in order to verify that email has been configured properly.

Date printed in barcode is now configurable as following:
Now when a screen is being repaired, a progress bar will appear.

Now a help message is displayed regarding the user's license and assigned Client ID.

With this feature, any layer on the canvas can be locked. A locked layer cannot be resized, nor can the user add ingredients/conditions to the layer. A locked Random layer will not regenerate if it is moved or copied.

In a multi-plate experiment, when you select a well of a plate that plate gets selected on the tree also.

Now the user can close multiple tabs at once by using the "Close All" option on the File menu.

When multiple images are selected on the Navigator Tab, they are displayed on the Compare Tab in a 2x2 layout allowing you to compare them easily and conveniently. You can view images of inspections, regions, capture profiles, or drops of a well in this manner. All views are kept in sync and multiple cursors will appear to help you better identify your experiment's features.

Image Now provides the user the ability to image the current plate as soon as the imager is available without having to be at the imaging controlling computer. This feature is available on the Imaging Tab and also by right-clicking a plate on the tree.

Image Management Task Preview states how many images will be affected by a given Image Management Task.

You can now configure the selection colors of wells and layers on the canvas. This new option can be found by clicking 'General' on the tree.

When you hover over any experiment on the tree, a tooltip will display the set incubation temperature for that experiment along with the experiment's ID, Name, Created Date, Plate Type, and Owner.

The Navigator Tab contains all the controls necessary to browse an experiment across its plates, wells, drops, regions, capture profiles, and imaging sessions. To aid in navigation, you can also have a main mode selected in which thumbnails are shown. Selecting a thumbnail will bring up that image in the main panel. The age of the image has also been added to show how long it has been since a drop was first imaged.

We've added the option for 'Drop Captures' on the right-click menus on both the Canvas Tab and the Drop Tab. A 'Single Drop Report' option has also been added to the right-click menu on the Drop Tab.

Hover over a stock low pH or stock high pH indicator on the canvas to have a tooltip display the buffer name and pH.

Hover over a protein drop on the canvas, and a tooltip will display the protein volume, well condition volume, additive volume, total volume, and additives in the drop.

| RMC-V310R117 |