Canvas Menu
Located on the experiment page, Canvas is the main workspace in ROCK MAKER. It displays experiments and screens and allows you to design your experiment.
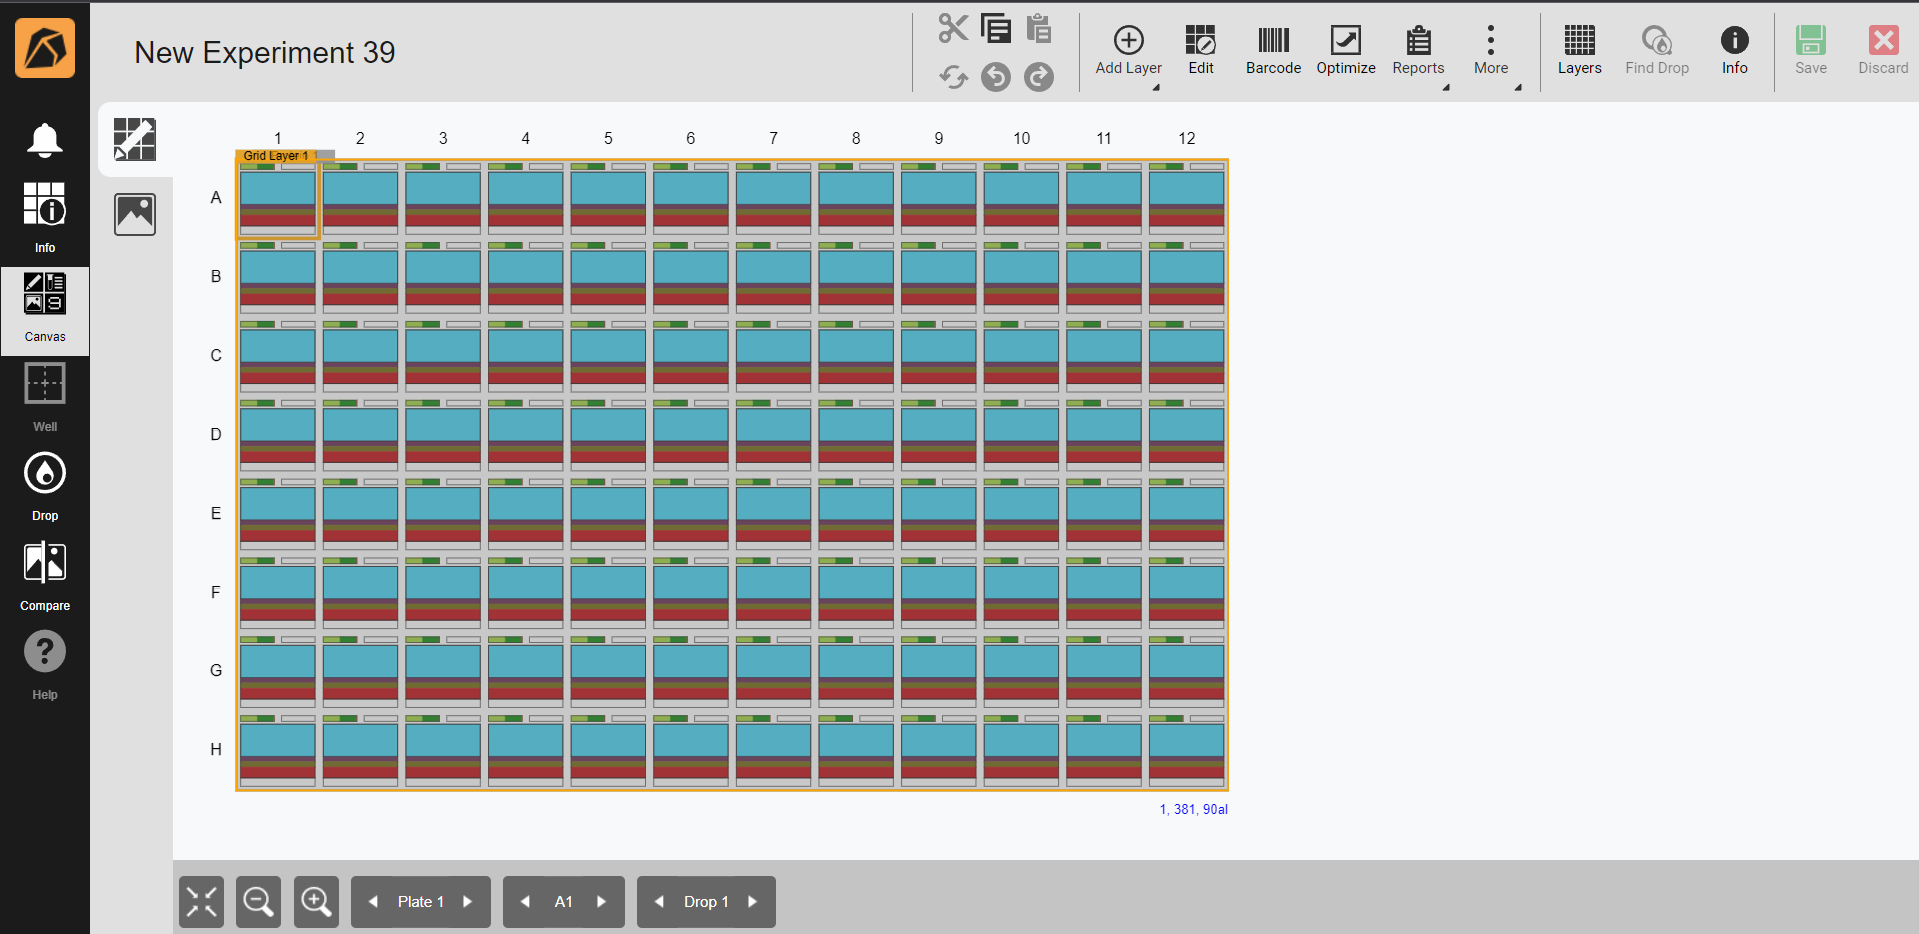
Experiment Page
There are two submenus in Canvas: Design  and Image
The Design Submenu
The Design submenu is where you can define experiment plates by creating layers and specifying layer parameters on the Layers Design panel. It is the default submenu when you click Canvas of a new or unimaged experiment.
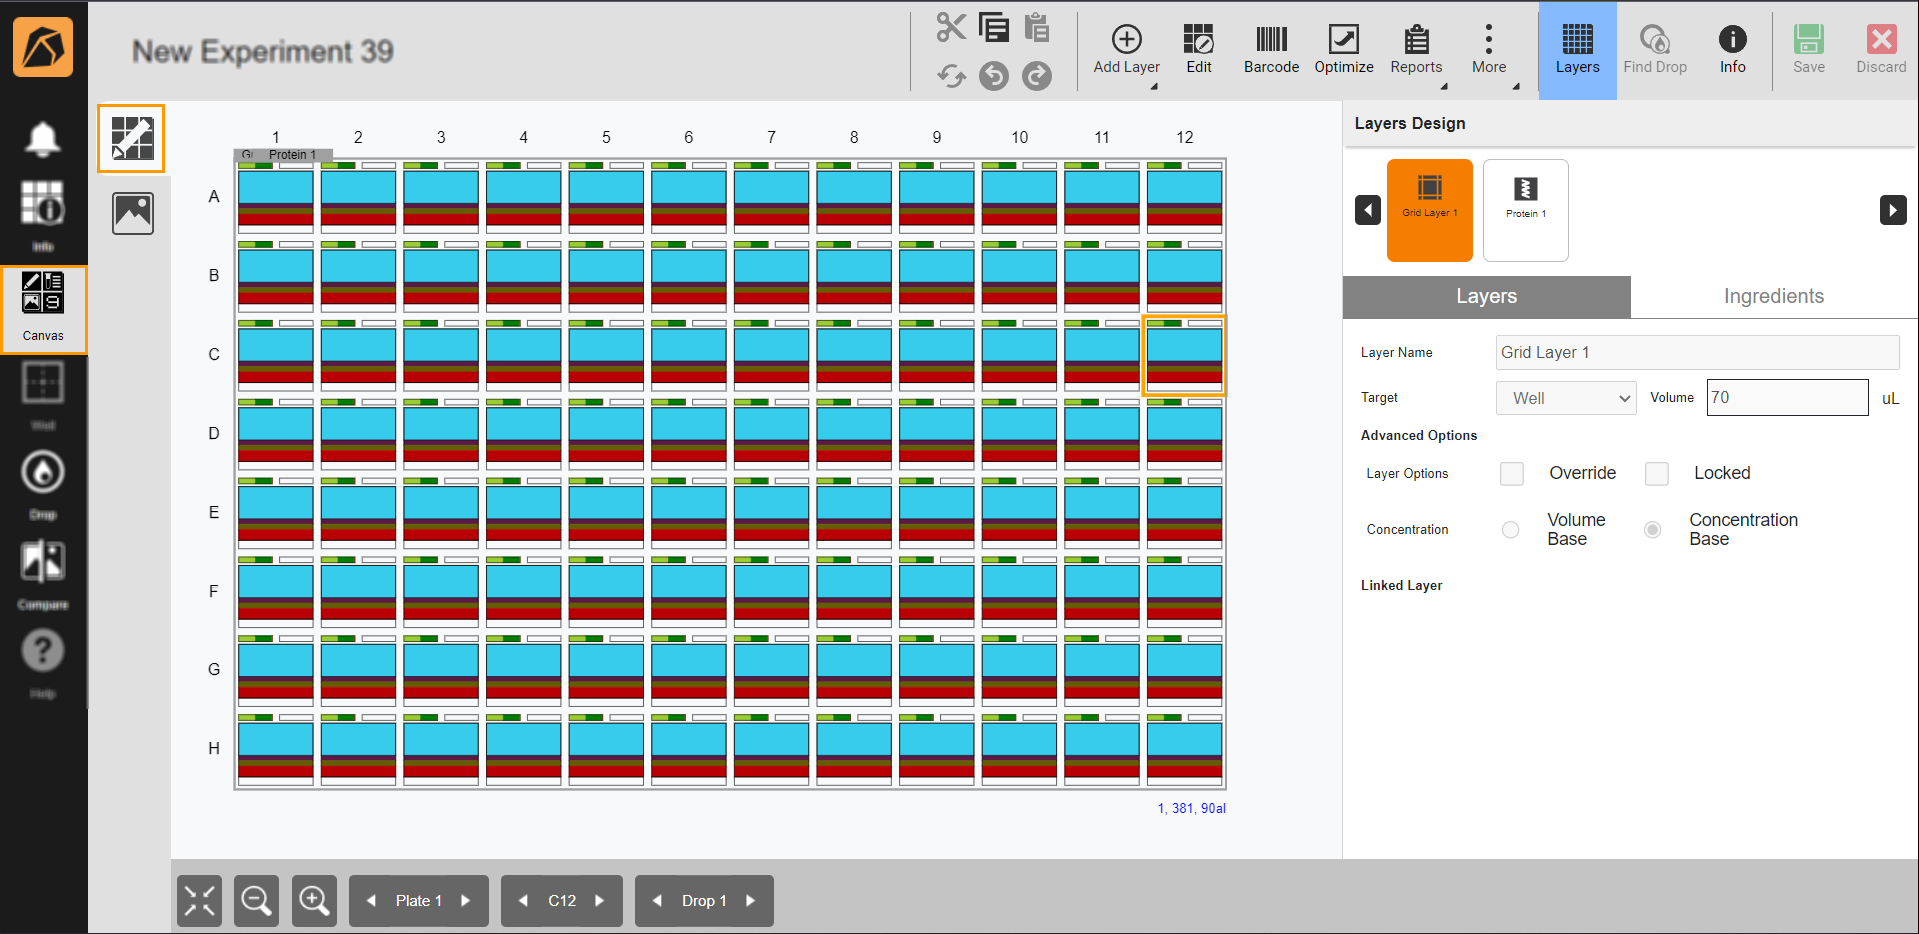
Design Submenu
Top Bar Buttons in the Design Submenu
Button |
Icon |
Description |
|---|---|---|
Combo Action |
|
Allows you to cut |
Add Layer |
|
Enables you to add Grid Layer, Random Layer, Custom Layer, Protein Layer, Seeding Layer, or Screen Layer. |
Edit |
|
Enables you to edit the design of a dispensed experiment. |
Barcode |
|
Enables you to print the barcode of an experiment. |
Optimize |
|
Allows you to optimize existing experiments and screens with single or multiple drop(s). |
Reports |
|
Allows you to generate a report from the available options. |
More |
|
Allows you to select Rotate Canvas, Convert to Screen, Import XML Screen, Import Fluidigm Screen, Import Text File, Export XML Screen, or Export Selected Well (TXT). |
Layers |
|
Enables you to modify the layer settings, such as naming the layer, selecting the target, and other related settings. To find out more, go to Layers Overview. |
Find Drop |
|
Allows you to highlight wells of interest using different search criteria, such as ingredient, well number, or label. |
Info |
|
Enables you to access information about a plate in detail. |
Save |
|
Allows you to save the experiment you create. |
Discard |
|
Enables you to discard experiments and changes. |


Bottom Bar Buttons in the Design Submenu
Button |
Icon |
Description |
|---|---|---|
Best Fit |
|
Allows you to adjust the display of your experiment page to fit your screen. |
Zoom Out |
|
Allows you to zoom out your software window. |
Zoom In |
|
Allows you to zoom in your software window. |
Plate |
|
Allows you to go from one plate to another in an experiment. You can click the left and right arrows or the Plate button to select a plate. |
Well |
|
Allows you to go from one well to another in an experiment. If you have multiple plates in an experiment, the Well button displays the corresponding wells of a selected plate. |
Drop |
|
Allows you to go from one drop to another in a selected well. |


The Image Submenu
Using the Image submenu, you can manage and organize your images in ROCK MAKER. It is the default submenu when you click Canvas of an imaged experiment.
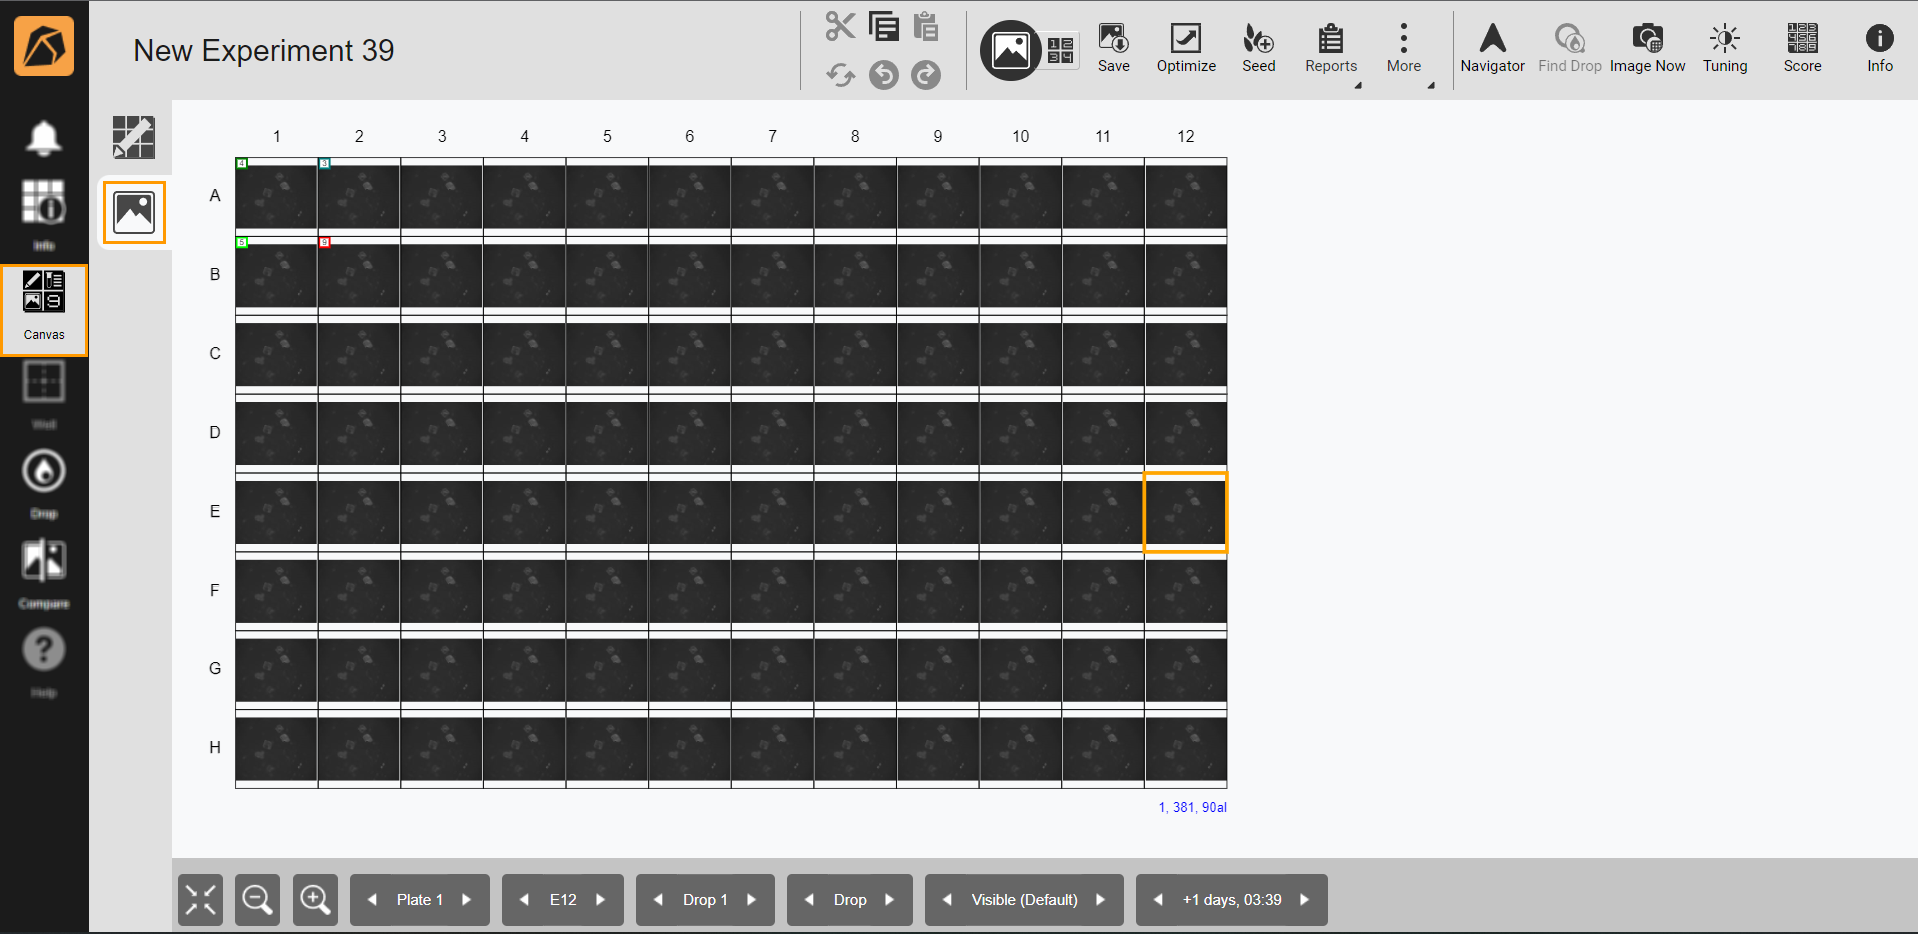
Image Submenu
Top Bar Buttons in the Image Submenu
Button |
Icon |
Description |
|---|---|---|
Combo Action |
|
Allows you to cut |
Switch View |
|
|
Save |
|
Allows you to save images to your local drive. |
Optimize |
|
Lets you optimize existing experiments and screens with single or multiple drop(s). |
Seed |
|
Allows you to create a seed. |
Reports |
|
Allows you to generate a report from the available options. |
More |
|
Allows you to select Disable/Enable Imaging, Manage Imaging, Add Images, Create New Inspection, Delete Inspection, Export POI, Export XML Screen, or Export Selected Well (TXT). |
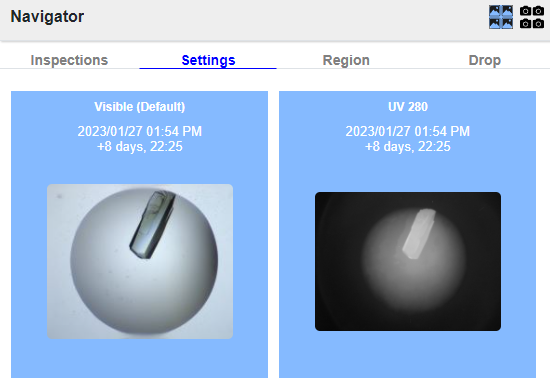
Navigator |
|
Allows you to navigate through your images using Inspections, Settings, Region, or Drop options. The Navigator panel is available on the right side of your ROCK MAKER window on click. Read more about Navigator Button.
|
Find Drop |
|
Allows you to highlight wells of interest using different search criteria, such as ingredient, well number, or label. |
Image Now |
|
This feature will be available soon. |
Tuning |
|
Enables you to adjust the brightness and contrast of your images. |
Score |
|
Allows you to score images and adjust the scoring settings. |
Info |
|
Enables you to access detailed information about your experiment, including experiment ID, ingredient information, imaging settings, and other related information. |


Bottom Bar Buttons in the Image Submenu
Button |
Icon |
Description |
|---|---|---|
Best Fit |
|
Allows you to adjust the display of your experiment page to fit your screen. |
Zoom Out |
|
Allows you to zoom out your software window. |
Zoom In |
|
Allows you to zoom in your software window. |
Plate |
|
Allows you to go from one plate to another in an experiment. You can click the left and right arrows or the Plate button to select a plate. |
Well |
|
Allows you to go from one well to another in an experiment. If you have multiple plates in an experiment, the Well button displays the corresponding wells of a selected plate. |
Drop |
|
Allows you to go from one drop to another in a well. |
Region |
|
Allows you to go from one region to another in a drop. |
Imaging Settings |
|
Allows you to go to any available imaging settings. |
Inspections |
|
Allows you to go to any available inspections. |


The Canvas menu is a visual representation of your experimental plate. For example, a 96-well experimental plate will be displayed in the Image submenu as 96 wells along with their respective drops.
The following design view shows a graphical representation of the ingredients you add to your experiment.
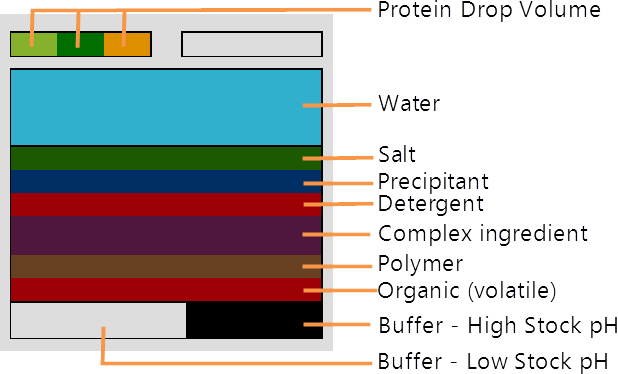
Ingredient Graphical Representation in Well(s) and Drop(s)
Each well on the Canvas contains the following graphical components:
Drop area. Rectangular boxes at the top of a well represent drops. In each drop that contains ingredients, relative volumes of the well and protein drops are represented by dark and light green shading. Orange represents an additive drop.
Note
Screens have no drop area since they don’t use proteins.
Well area. Below the drop area is a large square box displaying well ingredients. The thickness of the shading indicates the relative volume of each ingredient. Each ingredient type has its own associated color.
pH indicator. The pH indicator is a long rectangle at the bottom of a well. If a well contains a buffer, the pH indicator will indicate the relative amounts of the low pH and high pH stocks mixed to obtain the pH in a well. Gray shaded pH indicator indicates no stocks mixed.
Related Topics: