Calculating Buffer Titration Curves
The Titration Curve reflects the changes in pH (X axis) that occur as the concentration ratio (Y axis) of the acid and base that make up a buffer is varied. This data is used to determine how the acid and base that make up a buffer should be mixed in order to obtain a certain pH level.
Calculating the Titration Curve Using the Acid Dissociation Constant (pK a)
By default, ROCK MAKER generates the titration curve using the Henderson-Hasselbalch equation, pH = pK a + log10 ([Base]/[Acid]). The pK a value used in this calculation is displayed in the pK a box. You can change this value for polyprotic buffers if necessary.

Titration Data
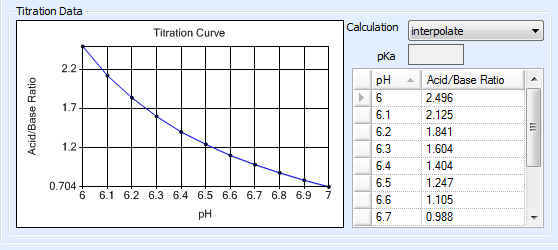
Calculating the Titration Curve by Interpolation
When dealing with polyprotic buffers that can have multiple pKa values, a more accurate titration curve can be achieved by manually entering pH measurements along with their corresponding acid-to-base ratios. You can obtain this data from a vendor or by using a pH meter to conduct your own measurements. ROCK MAKER interpolates the titration curve using the entered data points.
To enter titration data:
Next to Calculation, select interpolate.
Click in the first empty row of the table that is displayed and enter a pH value.
Enter the appropriate acid/base ratio for the entered pH value.
Repeat steps 2 – 3 to add more data points. The titration curve is generated as you enter the data.
Interpolation Data
Related Topics