Experiment Contextual Tab
When you design an experiment in ROCK MAKER, you use layers to define various properties. The tools necessary to create those layers and perform other critical functions can be found on the ribbon menu.
The Experiment contextual tab set is displayed when you create a new experiment. It is indicated in orange and includes the Design, View, and Reports tabs.

Experiment Contextual Tab
Design Tab
The Design tab includes four groups: Add Ingredients, Edit Layer, Tasks, and Import/Export. Each group contains different buttons that you can use to work with your experiment.
The Add Ingredients group provides you with buttons that you need to create various types of layers, such as grid, random, custom, protein, seed, screen, and fragment layers.
The Edit Layer group allows you to select any layer in your experiment and manage it using the Cut, Copy, Paste, Create Linked Layer, and Override Well(s) functionalities.
The Tasks group is where you can edit your experiment, create an optimization experiment, print a barcode, and convert an experiment to a screen.
The Import/Export group consists of the Import button, which enables you to import a file that contains ingredients or a screen into your experiment design, and the Export button, which allows you to export your experiment design into screen in an XML or TXT file.
View Tab
The View tab contains tools to customize your ROCK MAKER display and to show information related to an experiment.
You can use the buttons in the Zoom group to zoom in and out, enable one-click sizing, and lock the current zoom level while you view other drops in the Canvas.
Canvas Mode allows you to change the experiment’s display according to the enabled view mode. Design View shows a graphical representation of ingredients you have added to your experiment. This button will only be enabled when you open the experiment in the Canvas tab. Image View displays the images of drops that have been previously imaged. This button is accessible from the Canvas, Well, Drop, and Compare tabs. Ingredient View displays the information about the ingredients contained in each well and drop. This function will only be enabled when you open the experiment in the Canvas tab. The Score View displays the recent scores of all wells in the experiment.
Note
The Image View and Score View buttons will only appear when the experiment has images and/or scores.
You can also view information about the plate, ingredients in a well, ingredient summary, imaging settings, and the imaging schedule by clicking the buttons in the Info group.
The Focus Level Thumbnail button in the Show group enables you to display all of the focus level images and Extended Focus Imaging (EFI) images in thumbnails on the side of the Canvas. This can help you when reviewing darker images, such as the Second Harmonic Generation (SHG) images produced by SONICC.
Note
By default, this feature is set as disabled to automatically display the Focus Level Thumbnail, but can be enabled from the General tab in the Global Preferences window. For more information about how to enable this feature, see Viewing Focus Level Images.
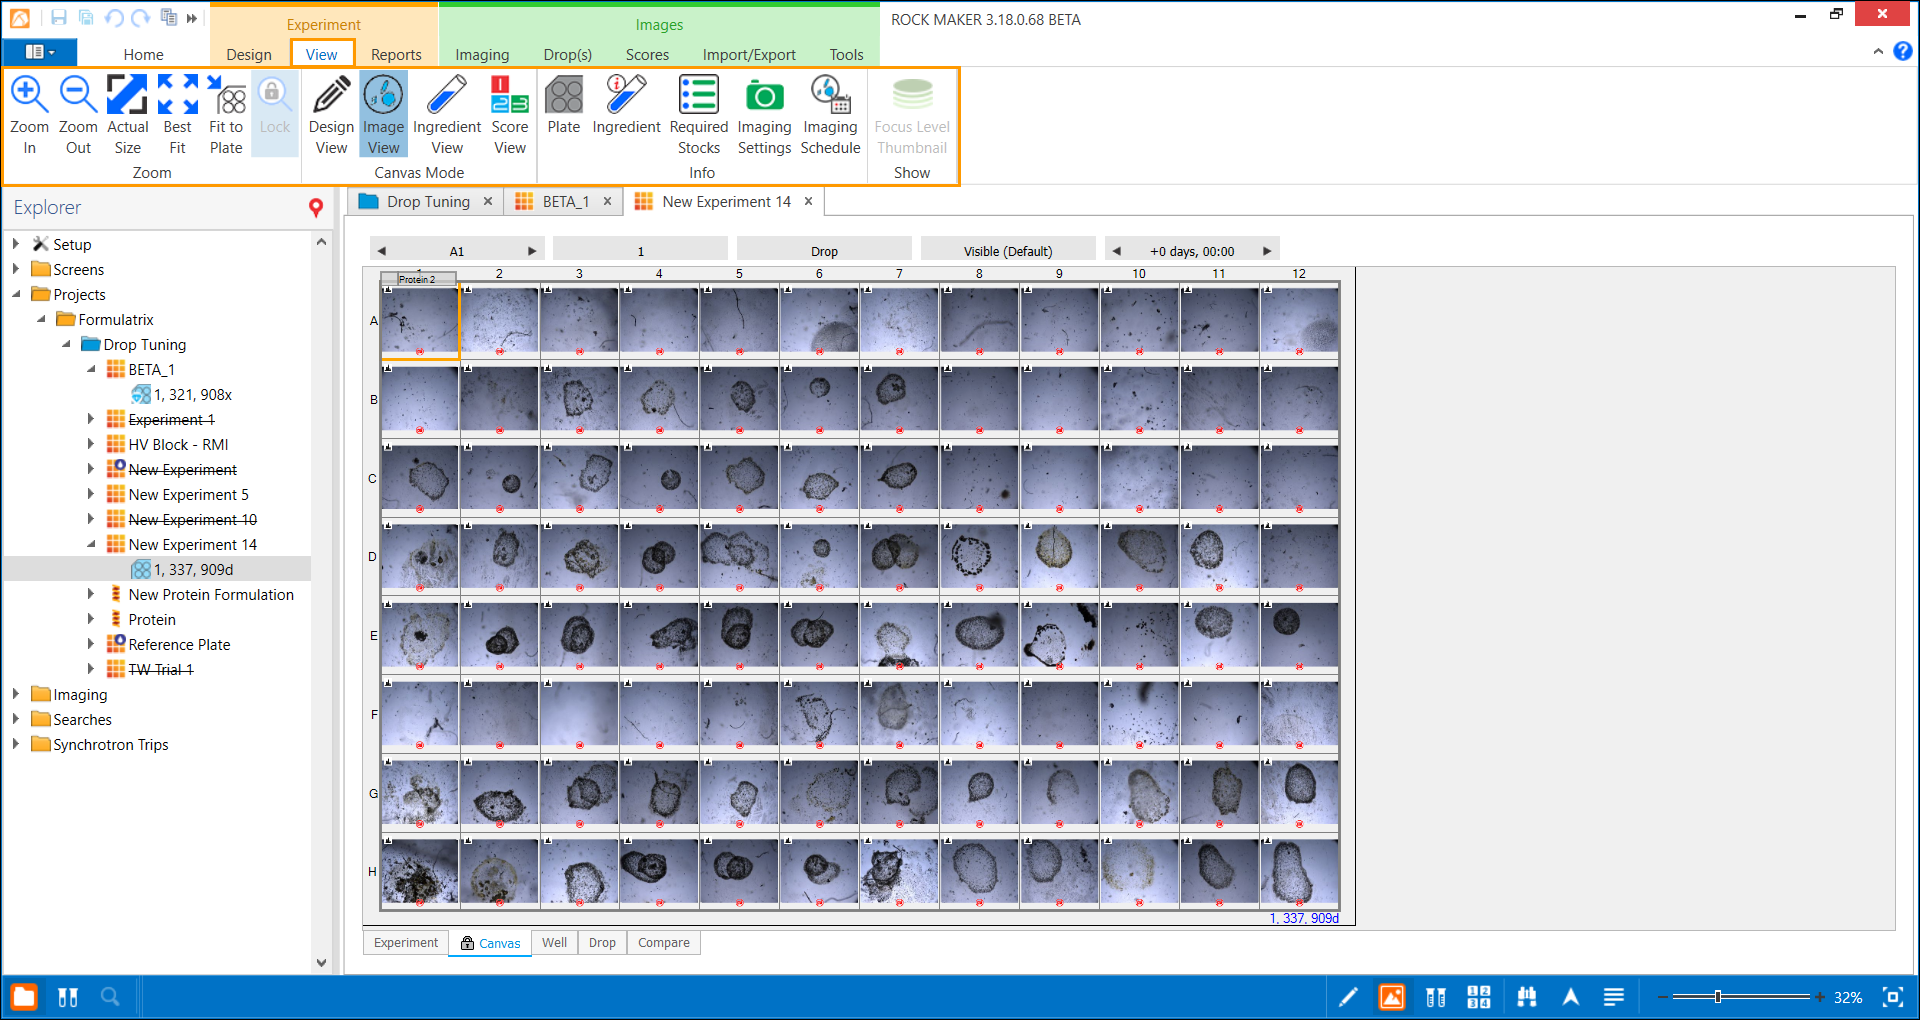
View Tab
Reports Tab
The Reports tab is where you can print out information about your experiment.
The reports tab includes buttons for an Instant Drop Report, Experiment Report, Design Report, Ingredient Report, Image Report, Single Drop Report, Well Report, Export Scores, and Export FRAP Data Points.
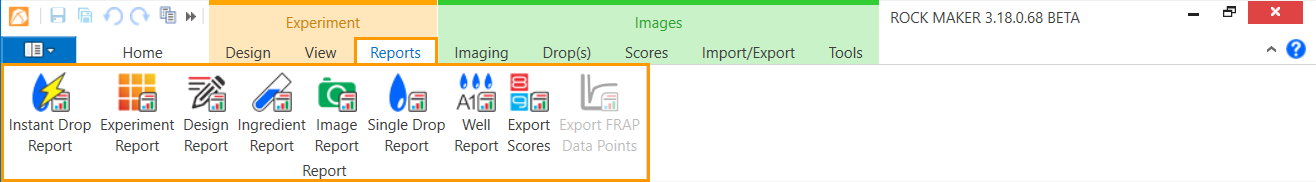
Reports Tab
Related Topics