Viewing the Buffer Mixing Curve
ROCK MAKER allows for the mixing of two buffer stocks with equal concentrations and different pH levels in order to obtain an intermediate pH level. The Mixing Curve graphically displays the relationship between the buffer mixture’s pH and the fraction of the mixture’s volume that is made up of the buffer with the lower pH. This graph reveals how the dispensing robot will mix the two buffers to obtain an intermediate pH.
To view the buffer mixing curve:
In the Add Ingredient dialog box or Edit Ingredient dialog box, hold down the Ctrl key and select two buffer stocks from the Stocks table that have the same concentration, as shown in the first image below. The mixing curve will be generated.
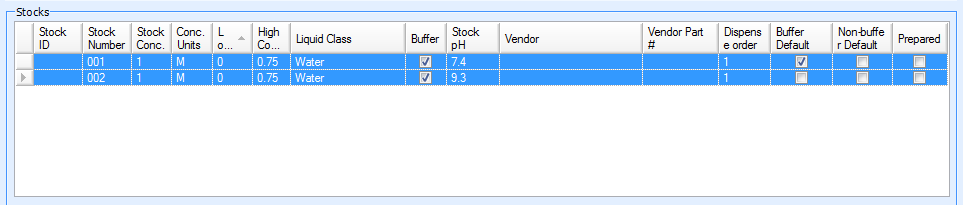
Stocks Table
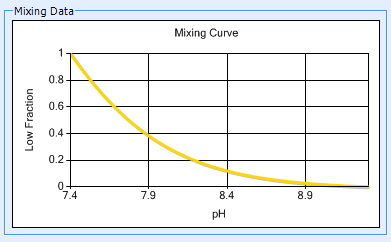
Mixing Curve
Related Topics