The Canvas
The Canvas is the main workspace in ROCK MAKER. This is where experiments and screens are displayed when you open them from the Explorer. As an artist starts with a blank canvas and creates his or her masterpiece, you will use a canvas to create experiments.
For each experiment or screen that is open, an experiment tab is displayed at the top of the workspace.
When you have many experiments or screens open at once, ROCK MAKER may
not be able to display all of their tabs at once. In this case, you can
scroll through the tabs by using the left and right arrows ![]() in
the upper right-hand corner of the workspace. To close the current
document, click
in
the upper right-hand corner of the workspace. To close the current
document, click  on the document’s tab.
Note
You can change the relative sizes of the left pane and the workspace by positioning the pointer over the line that divides the two. When the pointer turns into a vertical line with left and right arrows ![]() , drag the pointer left or right as needed.
, drag the pointer left or right as needed.
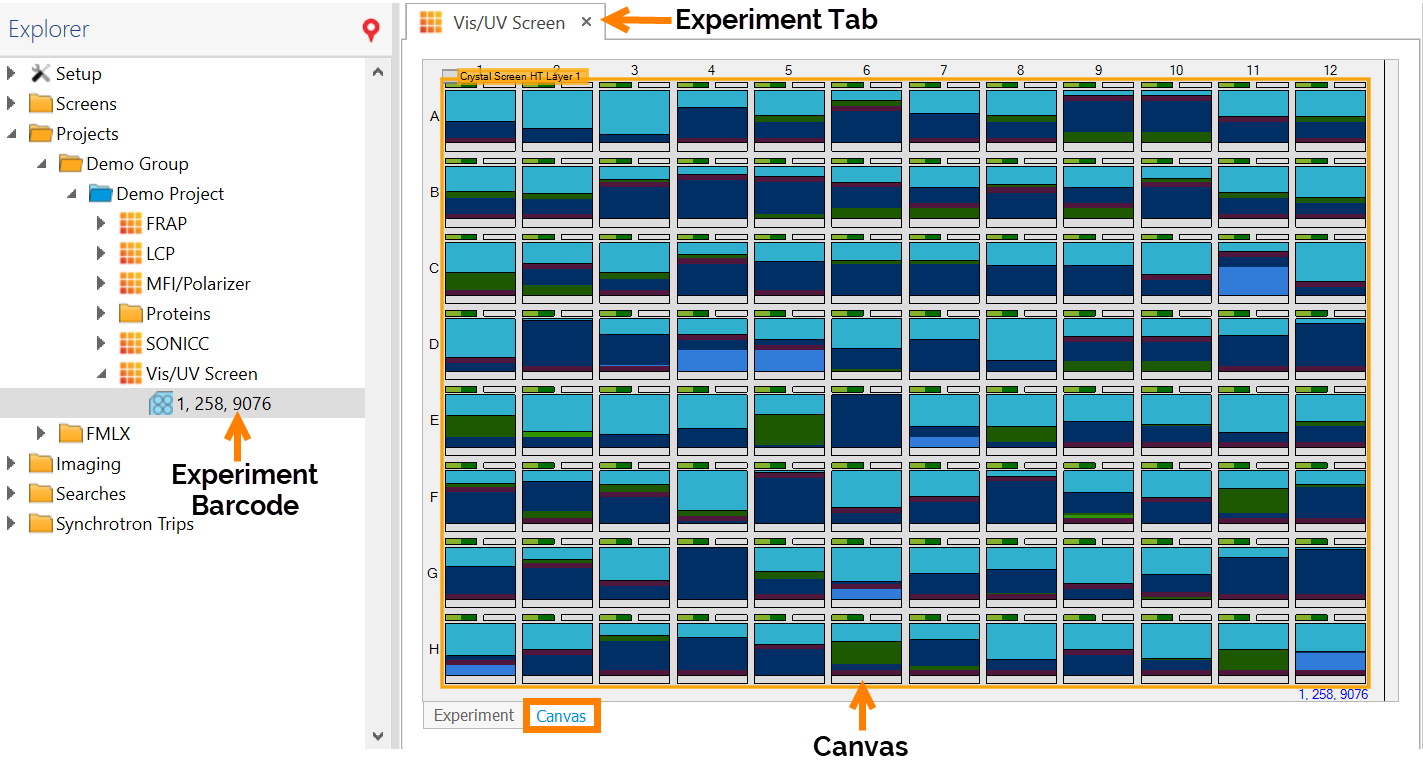
The Canvas
How Ingredients Are Represented on the Canvas
The Canvas shows 96 squares (if you are using a 96-well plate in your experiment). Each square has two small rectangles above the main center. The center represents the well. The two small rectangles represent protein drop locations.
Design view shows a graphical representation of ingredients you have added to your experiment.
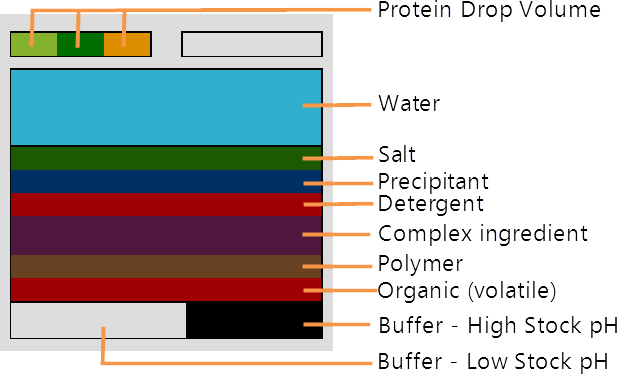
Ingredient Representative Colors
Each well on the canvas contains the following graphical components:
Drops area. Drops are represented by rectangular boxes along the top of the well. In each drop that contains ingredients, the relative volumes of the well drop volume and protein drop volume are represented by dark green and light green shading. Orange represents a drop additive.
Note
Since screens don’t use proteins, the drop area is omitted.
Well area. Below the drops is a large square box for displaying the well ingredients. The relative volume of each ingredient is indicated by the thickness of the shading. Each ingredient type has its own associated color, as shown in the above image.
Hint: Click a shaded portion of the well to see which ingredient it represents. The ingredient’s name will display in the Well Ingredient box on the Well Info tab.
pH indicator. The pH indicator is the long rectangle along the bottom of the well. When the well contains a buffer, the pH indicator will indicate the relative amounts of the stock low pH and stock high pH that were mixed to obtain the pH in the well. If no mixing of stocks occurrs, the pH indicator will be completely shaded gray.
Canvas View
You can view the canvas in several ways. Options include Design View, Image View, Ingredient View, and Score View.
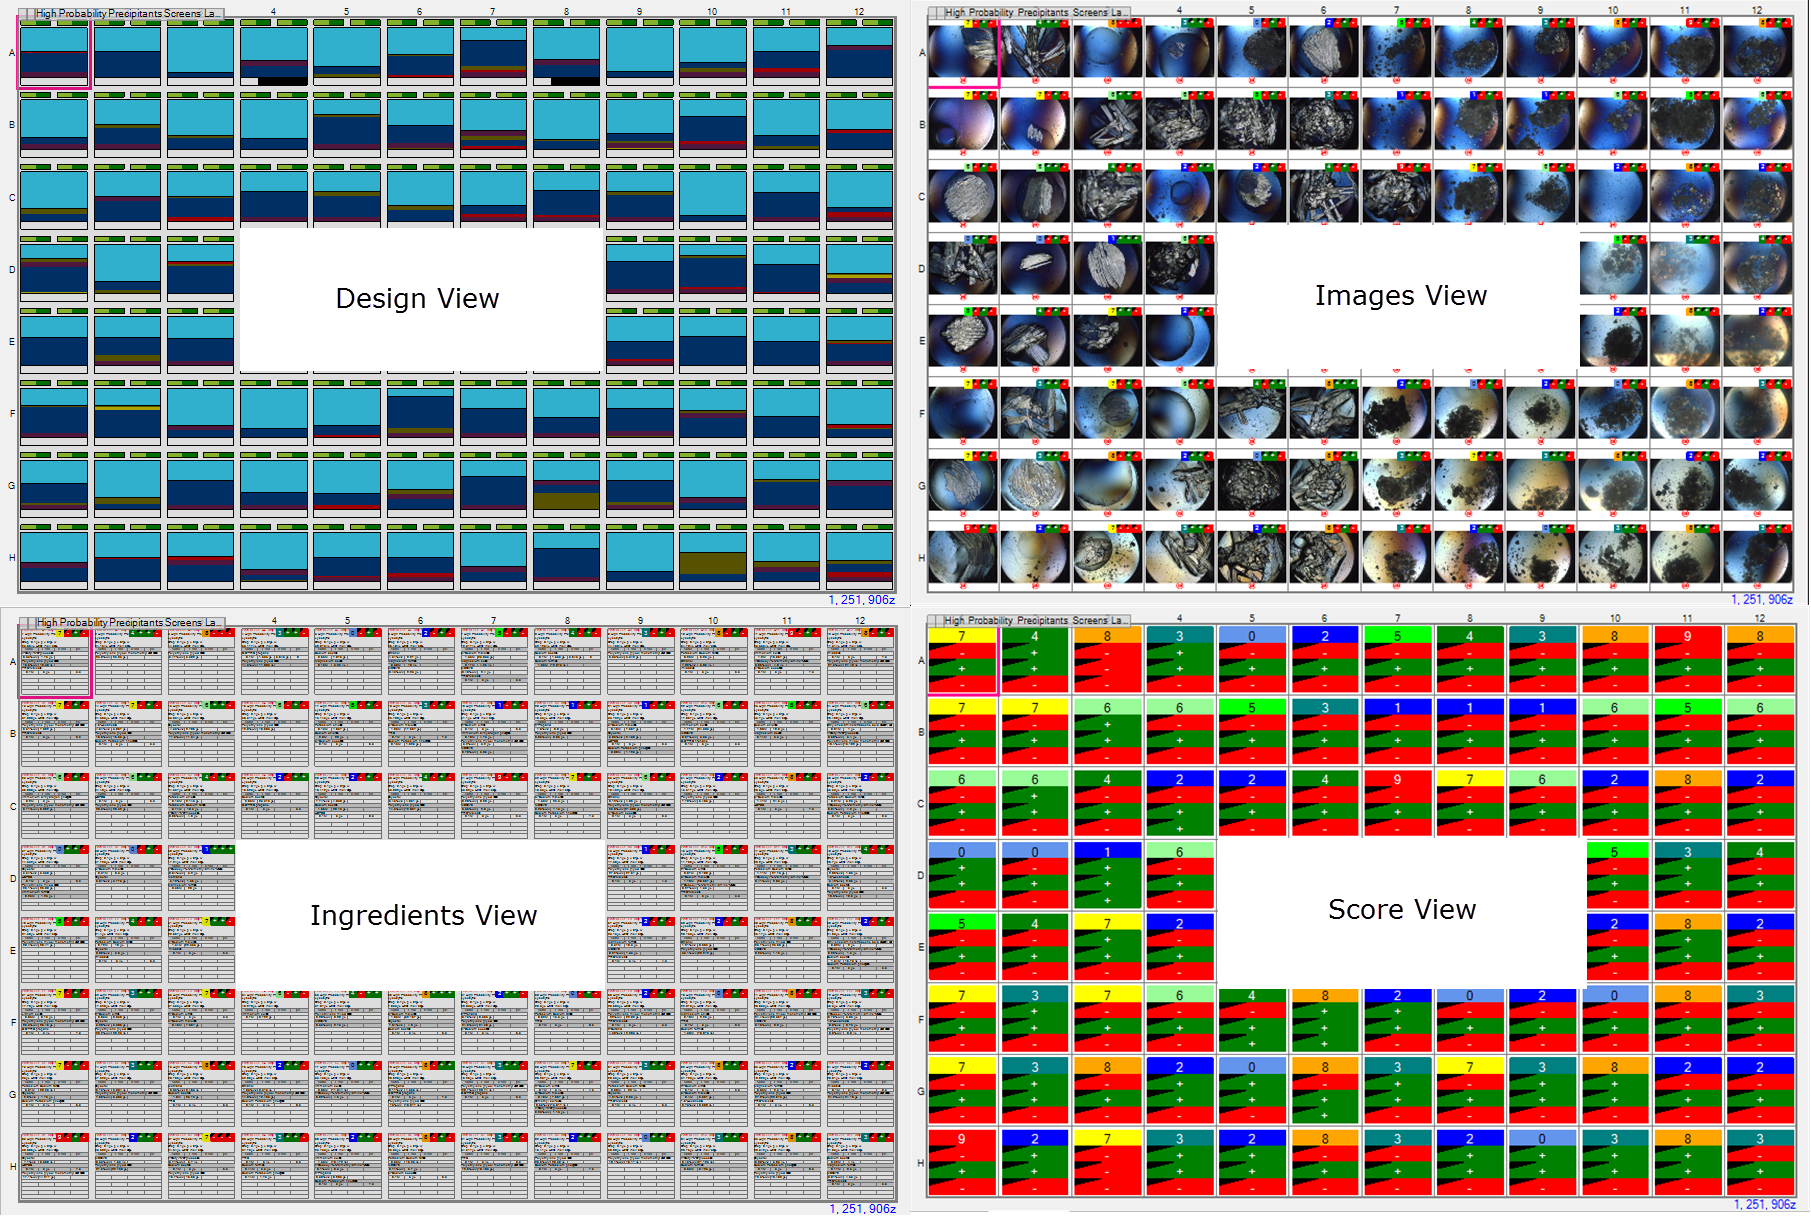
Different Canvas Views
There are two ways to switch between views. First, you can switch between views at any time by clicking one of the View buttons on the Viewbar.

You can also switch views once you have opened an experiment by clicking on the View tab of the Experiment contextual tab set and then selecting one view type in the Canvas Mode group.
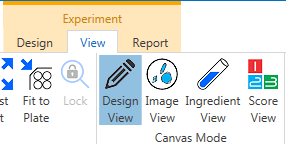
Canvas Mode Buttons on View Tab
Related Topics