Home Tab
The Home tab is displayed by default when you launch the ROCK MAKER software. Some features on the Home tab will only be available once you perform a certain task. For example, most functions in the Dispensing group will be available when you open an experiment.

Home Tab
Explorer Group
Most of the buttons in the Explorer group will not be available until you open an experiment. These buttons perform tasks related to the Explorer (tree node).
Icon |
Description |
|---|---|
Open Icon
|
Opens the selected item in the Explorer. You can also press Ctrl+O on your keyboard. |
New Folder Icon
|
Creates a new folder at your current location in the Explorer tree. |
Expand All Icon
|
Expands every project and folder in the Explorer tree. |
Rename Icon
|
Lets you rename the selected item in the Explorer tree. You can also press F2 on your keyboard to do this. |
Delete Icon
|
Deletes the currently selected item in the Explorer tree. |
Refresh Icon
|
Click this icon or press F5 on your keyboard to refresh images and database in ROCK MAKER. |
Show Info Icon
|
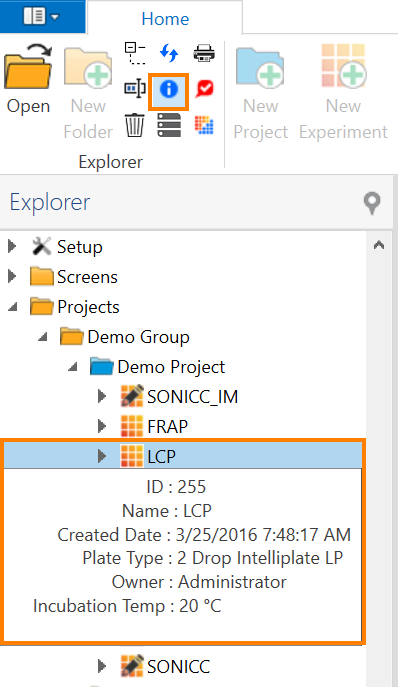
Shows you an information box for the currently selected item in the Explorer tree. In the example below, an experiment named LCP is selected in the Explorer, and when the Show Info icon is clicked, a white information box appears under it.
An Example of Information Box The Information Box contains a brief description of the selected experiment, such as the experiment ID, experiment name, creation date, or the plate type used. |
Storage Usage Icon
|
Click this icon to learn about the current storage usage. Learn more about viewing image storage usage. |
Print Barcode Icon
|
Enables you to print one or more barcode labels based on what you currently have selected in the Explorer tree. Learn more about printing barcode labels for your experiment here. |
Mark As Not Seen Icon
|
Marks the currently selected experiment in the Explorer tree as not seen, which can provide a visual cue to view and score images for that item later. This icon can only be used for experiments that have been imaged. Note: When you mark an experiment as not seen, the experiment name and its barcode number in the Explorer will be bolded. |
Convert To Screen Icon
|
Converts the currently selected experiment in the Explorer to a screen. |


Create Group
The Create group contains features that are related to experiment designs, such as creating new projects, experiments, protein formulations, seeds, screens, as well as the new search function.
Icon |
Description |
|---|---|
New Project Icon |
Creates a new experiment project at your current selected location within the Projects node in the Explorer. |
New Experiment Icon |
Creates a new experiment within your current selected project. |
New Protein Formulation Icon |
Creates a new protein formulation within your current selected project. |
New Seed Icon |
This icon will only be available once your experiment has been imaged. Clicking this button allows you to create a new seed layer. |
New Screen Icon |
Creates a new screen at your current selected location in the Explorer, either within a Screen node or Projects node. |
New Fragment Screen Icon |
Allows you to create a new fragment screen within the selected project in the Explorer. |
New Search Icon |
Allows you to search your ROCK MAKER database so you can analyze trends. Learn more about the Search function in ROCK MAKER. |
New Search and Filter Icon |
Allows you to customize and filter your search results to find specific information in your experiments. Learn more about using Search and Filter. |


Wizards Group
Just like its name, the Wizards group contains features that launch wizards related to experiment designs.
Icon |
Description |
|---|---|
Screen Experiment Wizard Icon |
Launches the Screen Experiment Wizard, which creates several screen experiments at once. |
Protein Formulation Wizard Icon |
Launches the Protein Formulation Wizard, which is a tool that uses an existing protein formulation to create multiple protein formulation at once. |
Batchload Experiments Icon |
Launches the Batchload Experiment Wizard, which creates multiple experiments using different screens and different protein formulations at once from a file. |


Tasks Group
The Tasks group contains functions to export and import experiments data.
Icon |
Description |
|---|---|
Export Icon
|
Allows you to export an experiment. |
Import Crystal CSV Icon
|
In synchrotron trip documentation, you can export your crystal data in a CSV format. This way, should any changes happen during crystal harvesting in the lab or diffraction data have been acquired, you can import the updated CSV file back to ROCK MAKER. |

Dispensing Group
After you have designed an experiment, you can tell ROCK MAKER to dispense your experiment design to a plate. The Dispensing group contains functions related to experiment dispensing.
Icon |
Description |
|---|---|
Dispensing Icon
|
Clicks this icon to open the Dispensing Tab, which contains the dispense queue and information of the dispensing robot integrated to ROCK MAKER. |
Dispensing Queue Icon
|
.Moves the currently selected experiment in the Explorer to the dispense queue. Read more about Dispense Overview. |
Mark as Dispensed Icon
|
Marks the currently selected experiment in the Explorer as dispensed. |
Dispensing Properties Icon
|
Opens the Dispensing Properties window where you can customize settings related to the dispensing robot integrated to your ROCK MAKER. |
Rack Editor Icon
|
Opens the Rack Editor window for your dispensing robot. This feature helps you keep track of the ingredients currently placed on the deck of the dispensing robot. |


Reports Group
In the Reports group, you can find various buttons to produce different kinds of reports for your experiments. This group only shows most commonly produced reports and therefore doesn’t represent all reports that can be generated in ROCK MAKER. Read Reports for more details.
Icon |
Description |
|---|---|
Hits Report Icon
|
Click this icon to produce a report that includes all drops that have been scored as a hit. |
Synchrotron Trip Report Icon
|
Once you create a synchrotron trip, you can print it out as a report or export it as a CSV file. |
Experiment Report Icon
|
Creates a report for the currently selected experiment in the Explorer tree. You can customize what information should be included in the report in the next window that appears after you click Experiment Report. |
Screen Report Icon
|
Creates a screen report for the currently selected screen in the Explorer tree. A screen report shows you the concentration, pH, vendor, and part number of every ingredient in a screen. |


Find Group
In the Find group, Experiment Or Screen tool lets you find the desired experiment and screens quickly, especially if you have quite large ROCK MAKER database.
Experiment Or Screen Tool
|
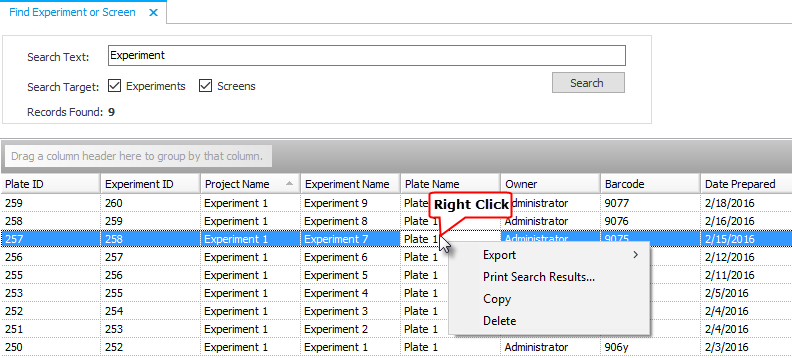
When you click the Experiment or Screen tool, a new tab opens in the main workspace area. You are presented with a Search Text box, several Search Target options, and a Search button. ROCK MAKER will search all columns on the table text matching the text you type into the Search Text box.
You can then click on any header row to sort by that category. |
Help Group
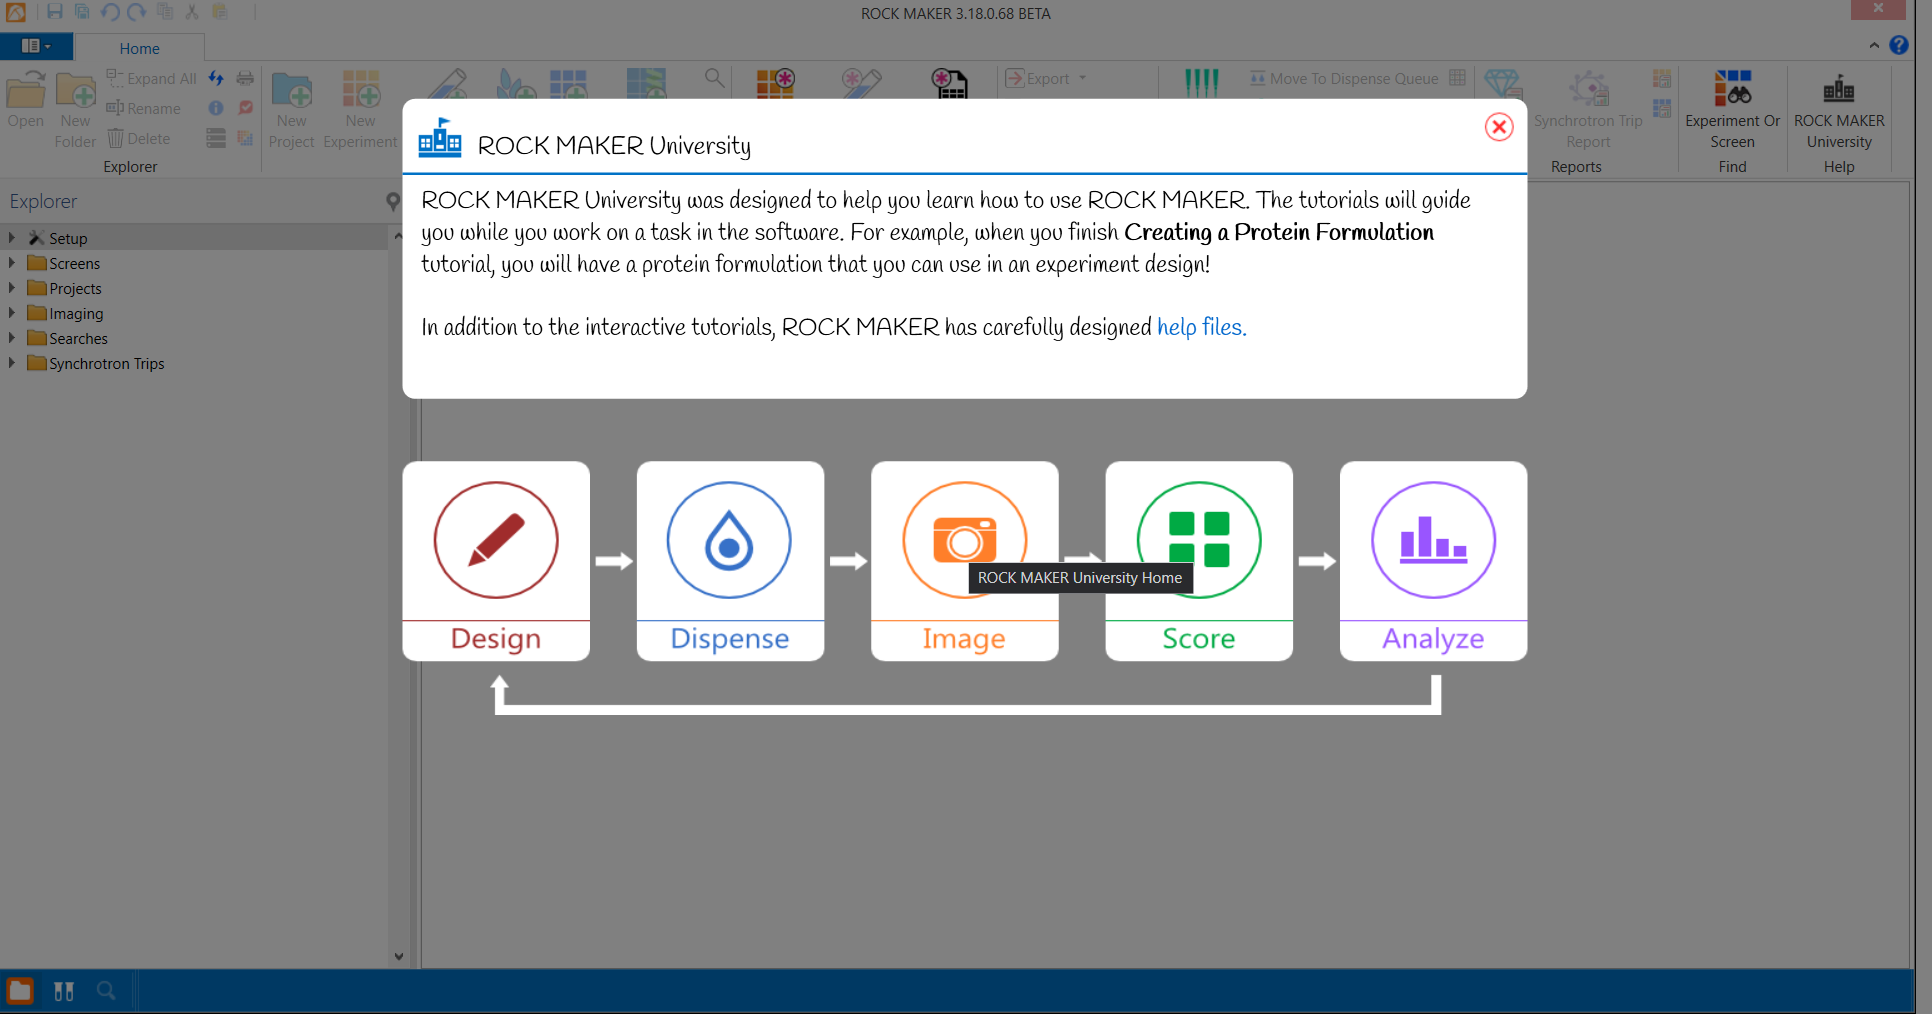
In the Help group, you will find ROCK MAKER University. It is an advanced, interactive help tool. It includes both software tours to get you acquainted with the software and tutorials that actually walk you through a common task, such as creating a protein or creating a screen experiment.
ROCK MAKER University Home
Tell me more about ROCK MAKER University
ROCK MAKER University consists of four categories, each of which contains a different list of tutorials. The four categories are as follows:
Design. This category provides you with tutorials related to experiment design, such as creating an experiment, creating a protein, creating a screen experiment, and grid optimization.
Dispense. This category provides you with tutorials related to dispensing experiment using a particular dispensing robot, such as NT8.
Image. This category provides you with tutorials related to viewing images in ROCK MAKER.
Analyze. This category provides you with tutorials on how to sort, view, and analyze your experiment results using Search and Filter.
Note
If the icon is a bus
 , then the tutorial is a tour, and will show you around the software and related tools you will use during that phase of the crystallization process. If the icon is a graduation cap
  , then ROCK MAKER University will have you perform a specific task, step-by-step.
1) Design
The Design category contains tours and tutorials which show you the basics of creating experiments in ROCK MAKER. The following tutorials are included:
The Design Tour
. This tour shows you some of the basic
tabs and tools you need to design an experiment, including the
Explorer and Canvas. This tour is highly recommended for new users.Make a Protein
. This tutorial shows you how to create
a protein in ROCK MAKER. Follow the instructions provided and by the
end you’ll have a protein that you can use in an experiment.Make a Screen Experiment
. This tutorial shows you how
to create a screen experiment. Like the protein tutorial, follow the
steps provided and you’ll be able to use the resulting experiment
when you’re finished.Grid Optimization
. This tutorial shows you how to
optimize your ingredients around a selected well or wells. Follow the
onscreen instructions as you move through the steps to generate a
usable optimized experiment.
2) Dispense
The Dispense category contains one tutorial on how to integrate ROCK MAKER with the NT8 dispensing robot. The following tutorial is included:.
NT8 Sitting Drop
. This tutorial walks you through the
process of creating a sitting drop experiment to be dispensed with
the NT8. You must have already created the protein you wish to
dispense in order to complete this tutorial. When you’re finished,
you will have an experiment that’s ready for dispense.
3) Image
The Image category contains tours on how to view images and use the Navigator. The following tours are included:
Images Tour
. This tour shows you how to view your
images in different ways using the Canvas, Well, Drop, and Compare
tabs. It also shows you some helpful features such as the ability to
add scores or annotations to your images.Navigating Images Tour
. This tour shows how to
move between your images in different ways using the Navigator. You
can look through your images based on several parameters, including
imaging type or inspection date.
4) Analyze
The Analyze category contains tours on how to retrieve, view, and analyze your experiment results using Search and Filter. The following tours are included:
Search and Filter Tour
. This tour shows you the basic
features of Search and Filter, including how to narrow down your
results with constraints and how to interpret your results after
they’ve been returned.Search and Filter Tutorial
. This tutorial shows you
how to create a search that isolates the concentration level of the
precipitant ingredient that yields the most crystalline results. You
will learn how to use constraints and filters to extract precise data
from your search results, and you will be able to save your search
for future use.
Related topics